| home previous page |
NORLEX |  |
| home previous page |
NORLEX | |
Note: Postal addresses to be completed
Click on images for full resolution.
The whole document, including formation and members, is available as a Word file (27 MB).
Whilst finer siliciclastic units largely remain as previously defined, sandstone/siltstone formations and one (reworked) chalky unit are now included as members. With the new definitions and redefinitions the Rogaland Group now consists of four formations and seventeen members (Table 1), which span the stratigraphic interval from lower Paleocene to lower Eocene. The revisions concerning the sandstone bodies are of four different types:
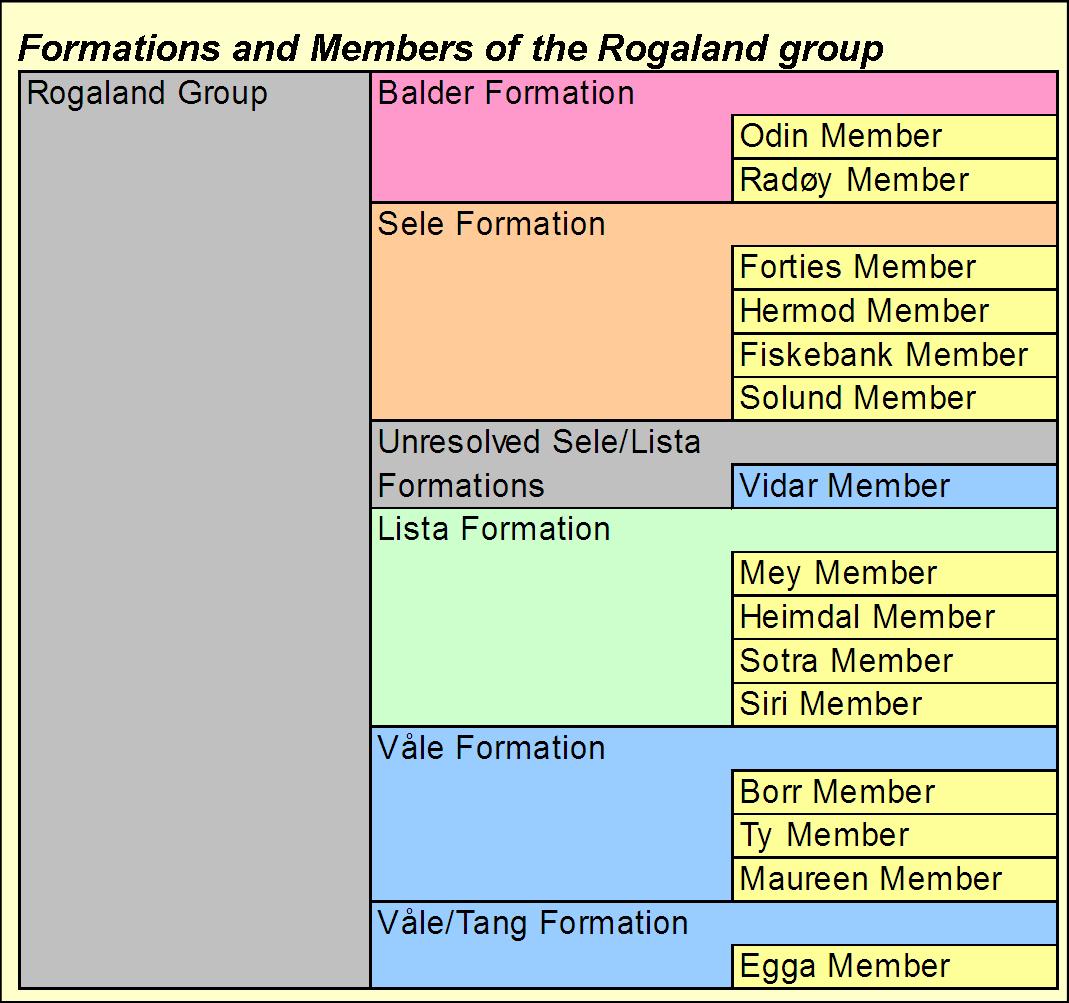
Table 1. Overview of the Formations and Members of the Rogaland Group, Paleocene - Lower Eocene, North Sea, Norway.
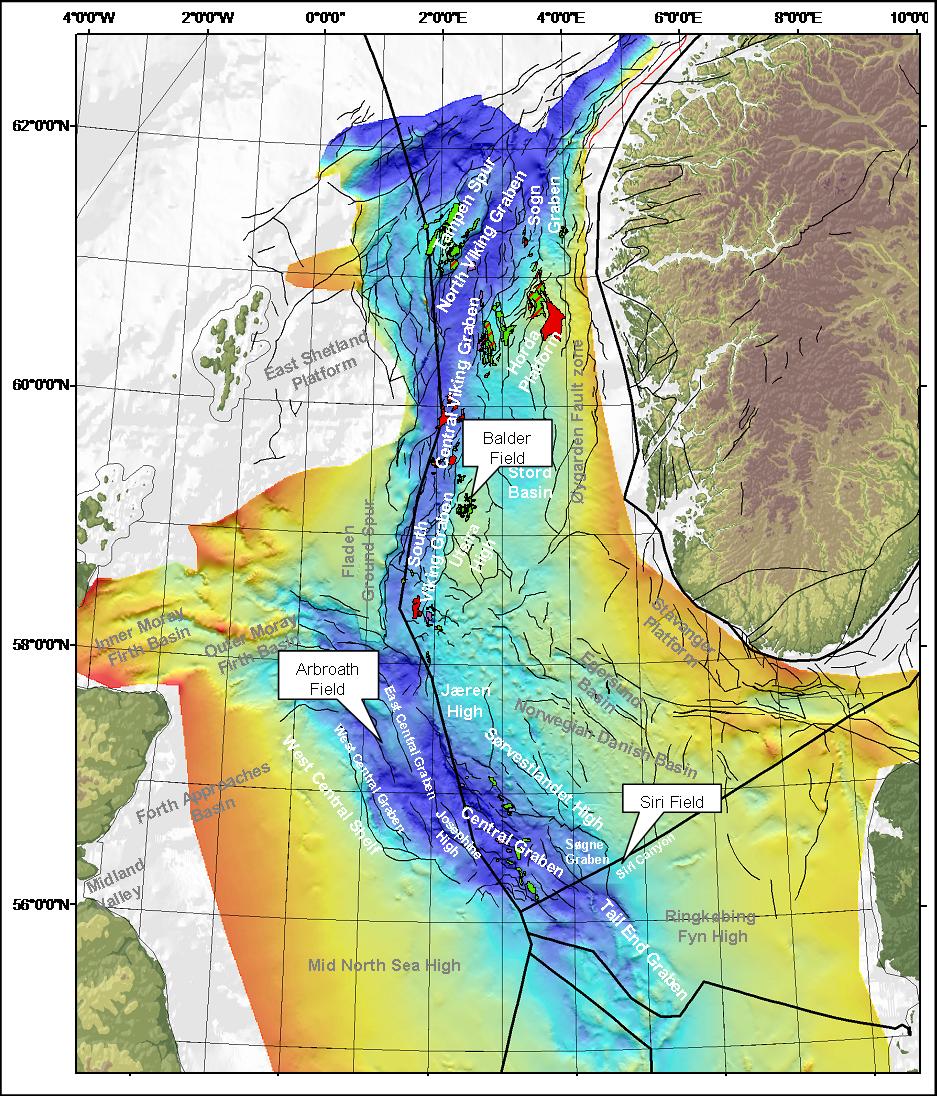
Fig. 1. Structural elements of the Norwegian North Sea at BCU level, with the first Paleogene hydrocarbon discoveries in Norway (Balder, 1967), UK (Arbroath, 1969) and Denmark (Siri, 1996) outlined. |
Paleocene to lowermost Eocene strata are extensively distributed throughout the whole of the North Sea Basin, and provide one of the most prolific hydrocarbon plays in the Norwegian North Sea. Hydrocarbons were first discovered in strata belonging to this age in 1967 at the Balder Field (Fig. 1) in the Norwegian sector and the first discovery in the UK, the Arbroath Field was in 1969. In the Danish sector, the Siri Field discovery was made in 1996 (Ahmadi et al., 2003).
Paleocene to lowermost Eocene sediments in the central and northern North Sea range in depths close to sea bed to more than 3000m, and reach a thickness of approximately 1000 m in the Outer Moray Firth. Fig. 2 shows a time depth map and areas of shallow and deep burial, whereas the time thickness map in Fig. 3 shows distribution of thin and thick development of the Rogaland group.
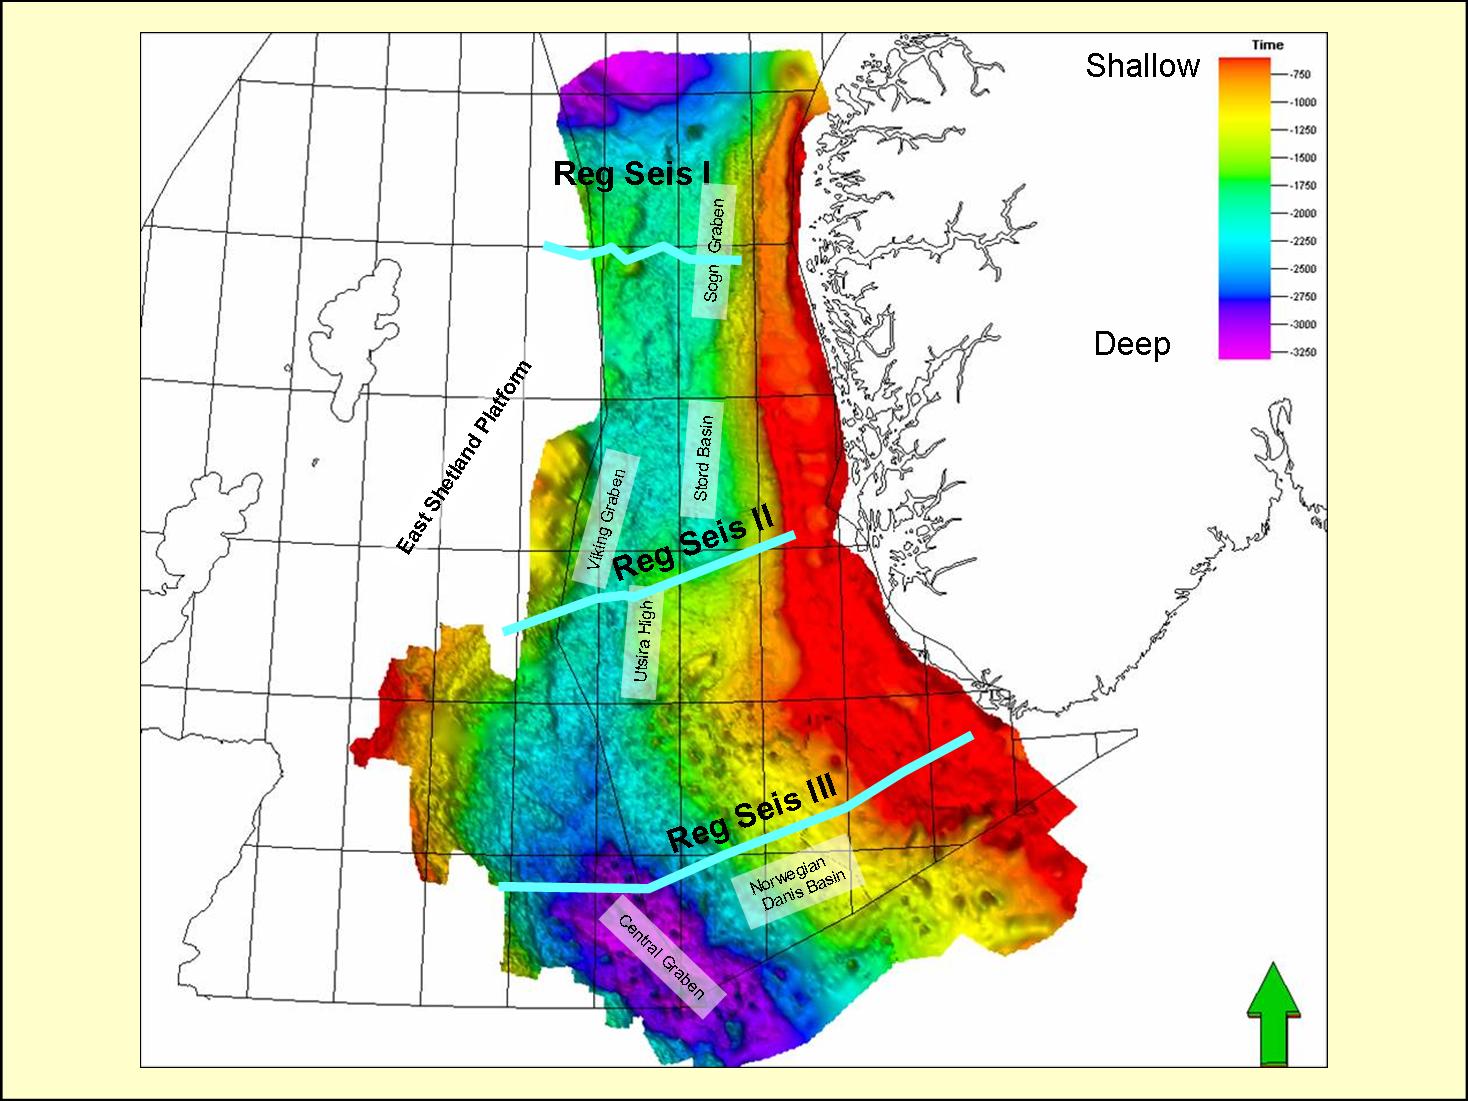
Fig. 2. Seismic time map of the Base Rogaland Group (Top Shetland Group) seismic horizon. Orientation of regional seismic lines I-III are shown as blue lines. |
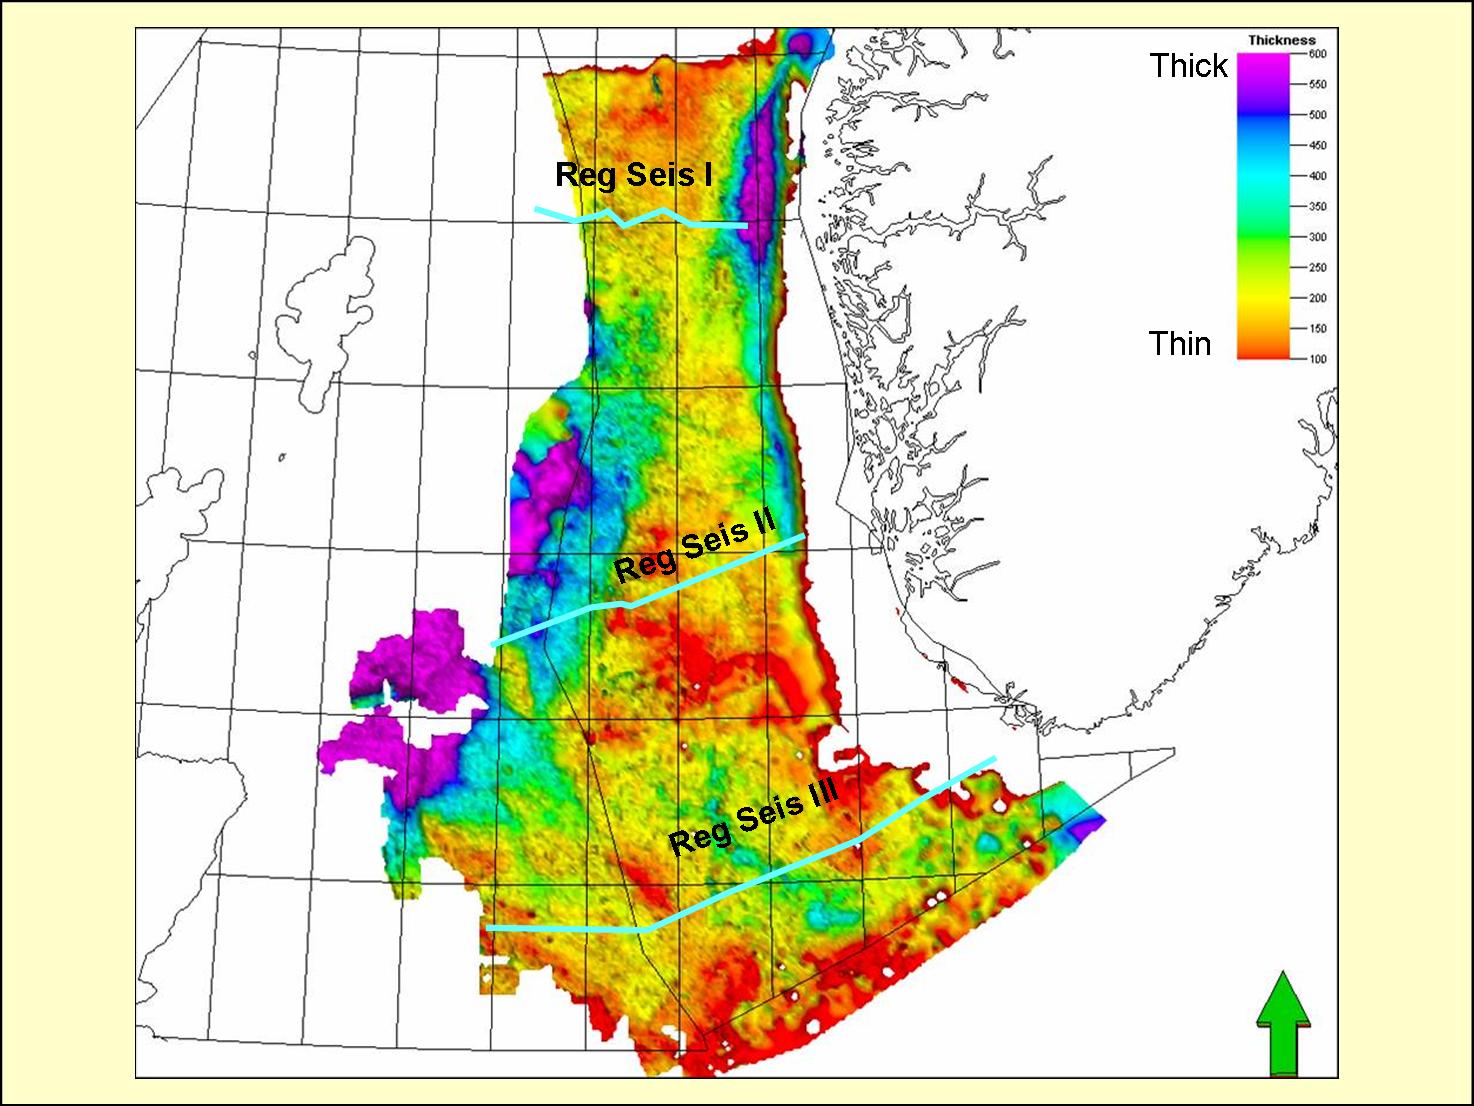
Fig. 3. Seismic time thickness map (TWT) of the Rogaland Group (Top Balder Formation to Top Shetland Group). Outlined regional seismic lines I-III are shown in Figs. 16-18. |
Improvements in seismic acquisition and processing quality and the application of high resolution biostratigraphy have caused a sustained interest in this stratigraphic interval. Although this play model has existed for a long time, discoveries are still being made, exemplified by the 16/4-4 and the Storskrymten discoveries made in 2007.
The Rogaland Group comprises the most sandprone interval of the Paleogene (Ahmadi et al, 2003; Liu & Galloway, 1997). The preserved strata in the North Sea consist of siliciclastic sediments with volumetrically minor amounts of coal, tuff, volcaniclastic rocks, marls and reworked carbonate sediments. The Scotland-Shetland hinterland was the primary source for the great volumes of siliciclastic sediment (Morton et al., 1993; Ahmadi et al., 2003), but also Fennoscandia acted as a provenance.
During the Early Paleogene, basin architecture evolved from basin-centered to basin margin deposition as Atlantic and European tectonic events, oceanographic trends, eustacy, differential tilting and subsidence, climate and variable sediment supply all combined to influence the depositional systems (Milton et al., 1990; Ziegler, 1990).
Lithofacies distribution within individual depositional systems were controlled by the combined effects of evolving basin physiography, underlying Mesozoic structures, syndepositional tectonics and halokinesis (Ahmadi et al., 2003).
Tectonic activity at this time was related to the development of the Iceland Plume, which caused regional uplift and gradual enclosing and isolation of the North Sea basin from the Atlantic Ocean (Fig. 4) . Adjacent to the North Sea, the Scottish Highlands and the East Shetland Platform were uplifted, together with a somewhat less magnitude of uplift of Western Fennoscandia. Further stresses along the line of the future north-east North Atlantic Ocean led to major volcanic activity in that region, which is represented in the sedimentary strata as tuffs. The seismic time thickness map in Fig. 3 clearly demonstrates the development of thick Paleocene-Earliest Eocene deposits adjacent to these areas.
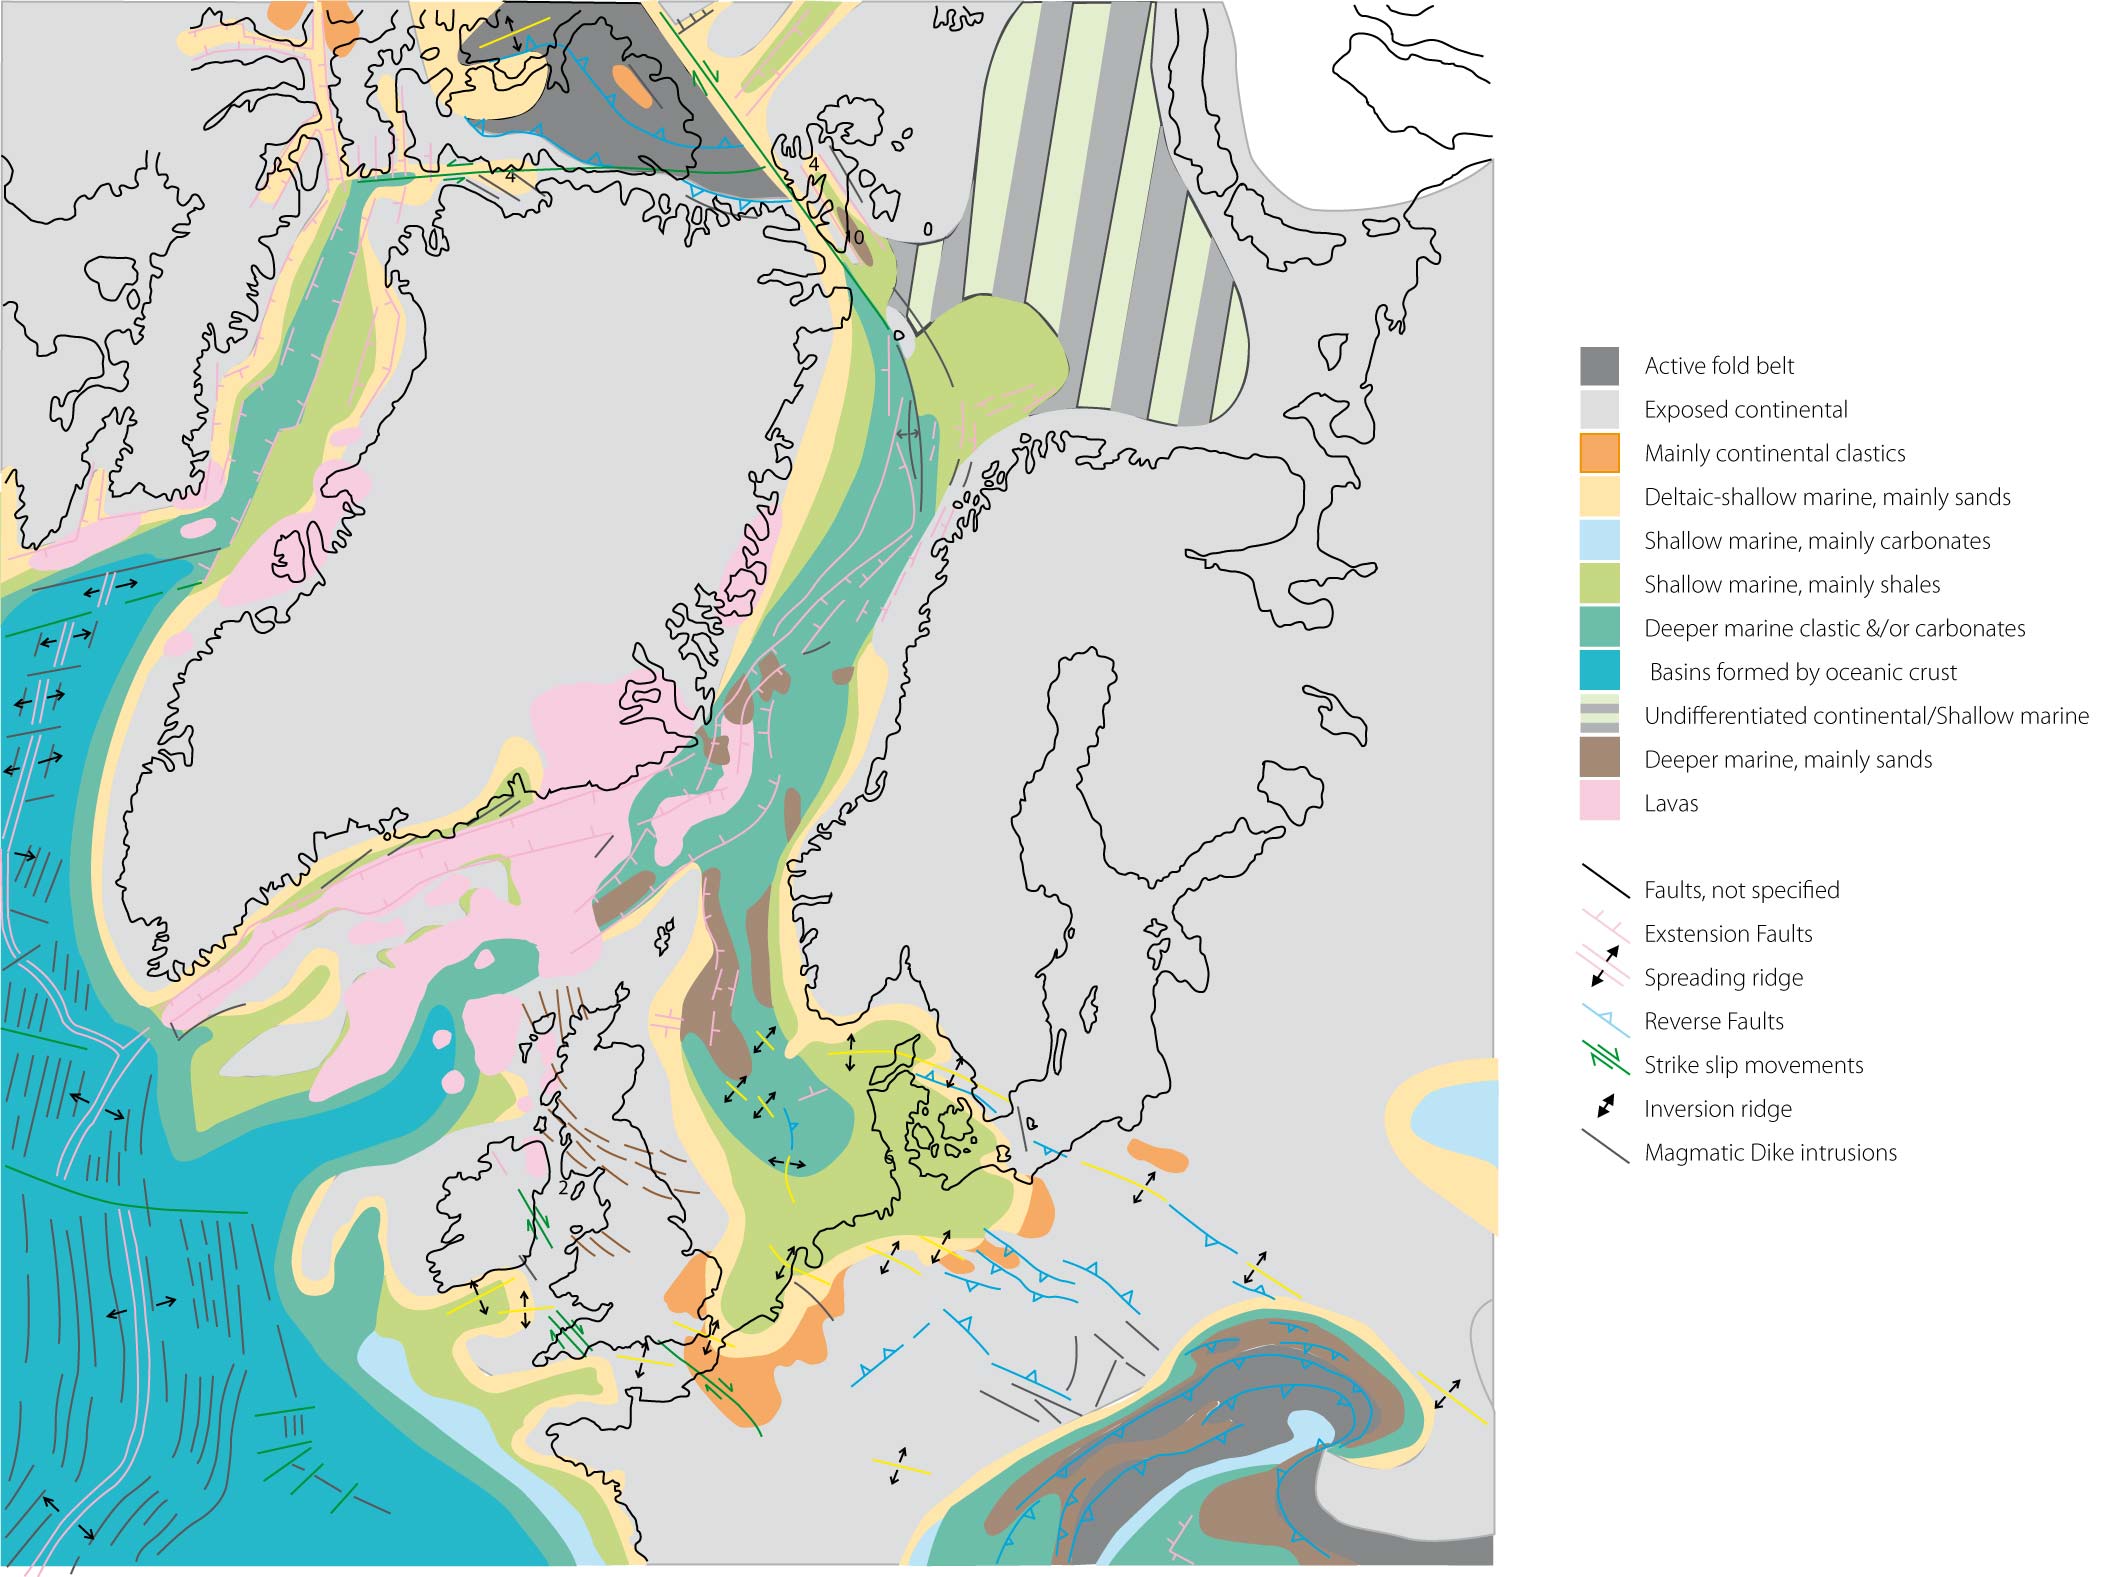
Fig. 4. Global reconstruction of North West Europe in the Late Thanetian, the period of maximum basin restriction of the Early Paleogene. Modified from Ziegler (1988), Torsvik et al. (2002) and Coward et al. (2003). |

Fig. 5. Geological Time Scale 2004 (Gradstein et al., 2004, modified by Simmons et al, 2007) highlighting stages with Global Stratotype Selection Points (GSSP), which is a location specific bedding plane where the base of each stage is defined. This definition is tied to an event in the rock record useful for correlation. As can be seen one GSSP has been defined within the time period when the Rogaland Group was deposited, the Thanetian/Ypresian transition 55.8Ma, which is internally in the Sele Formation, close to the boundary between the Upper and Lower Sele Formation. |
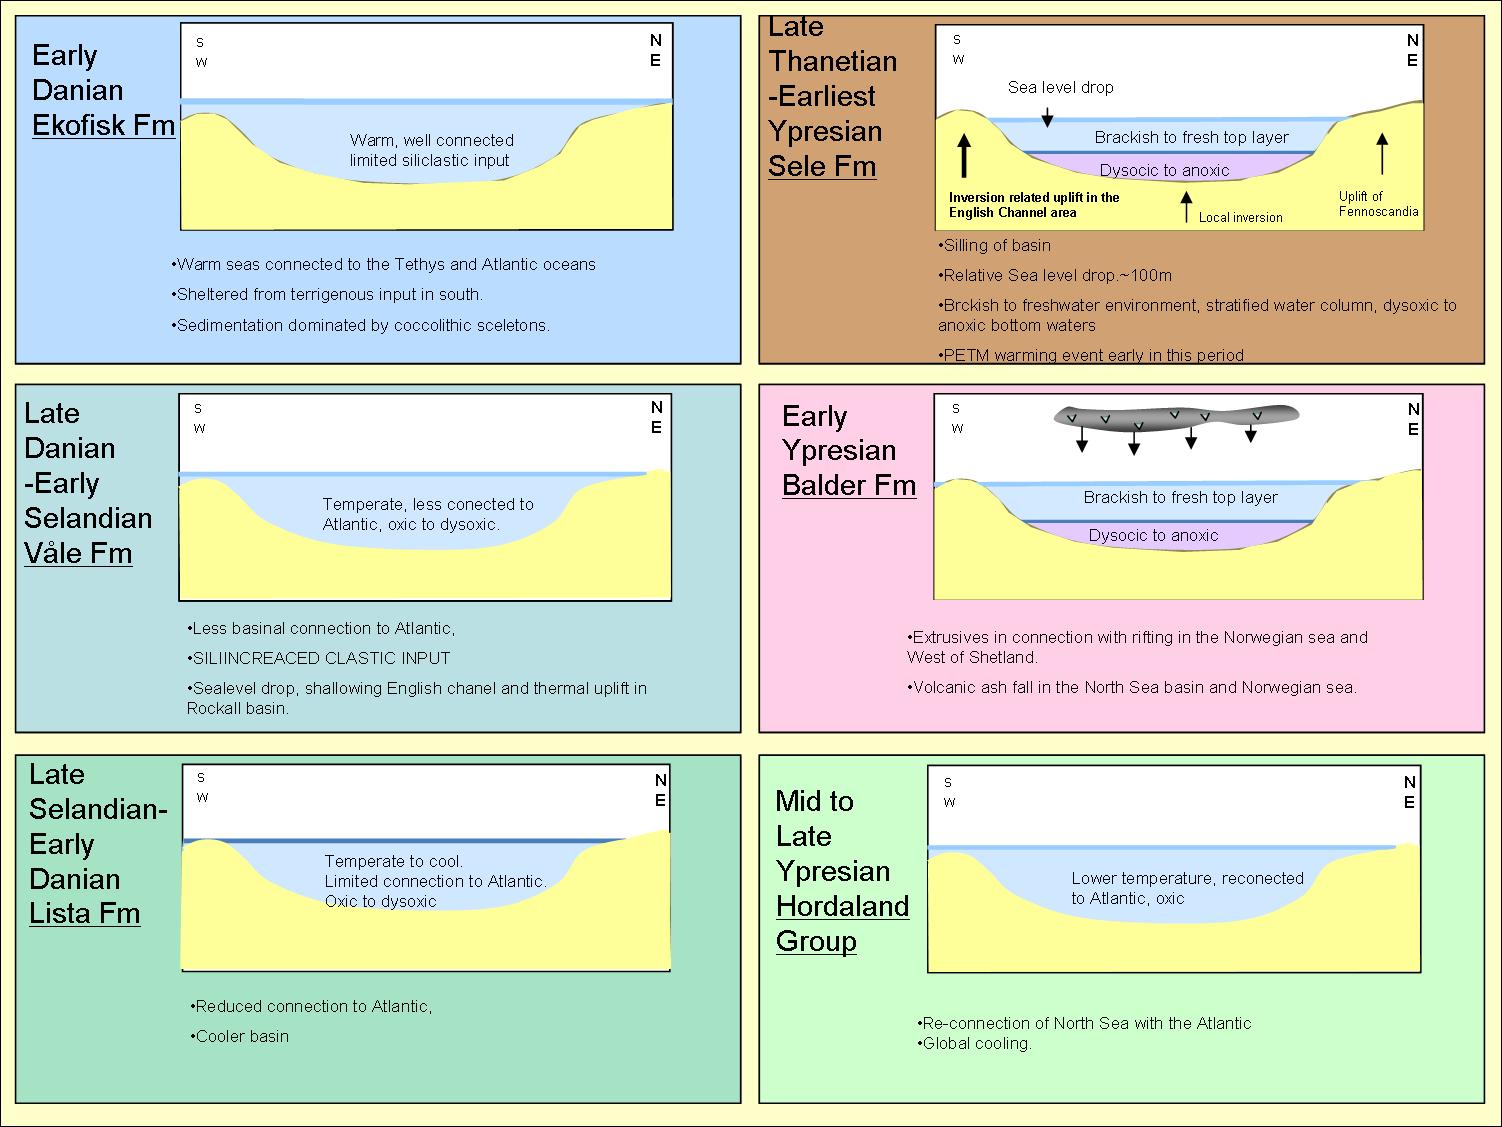
Fig. 6. Simplified basin development in the North Sea Basin through the Early Paleogene. |
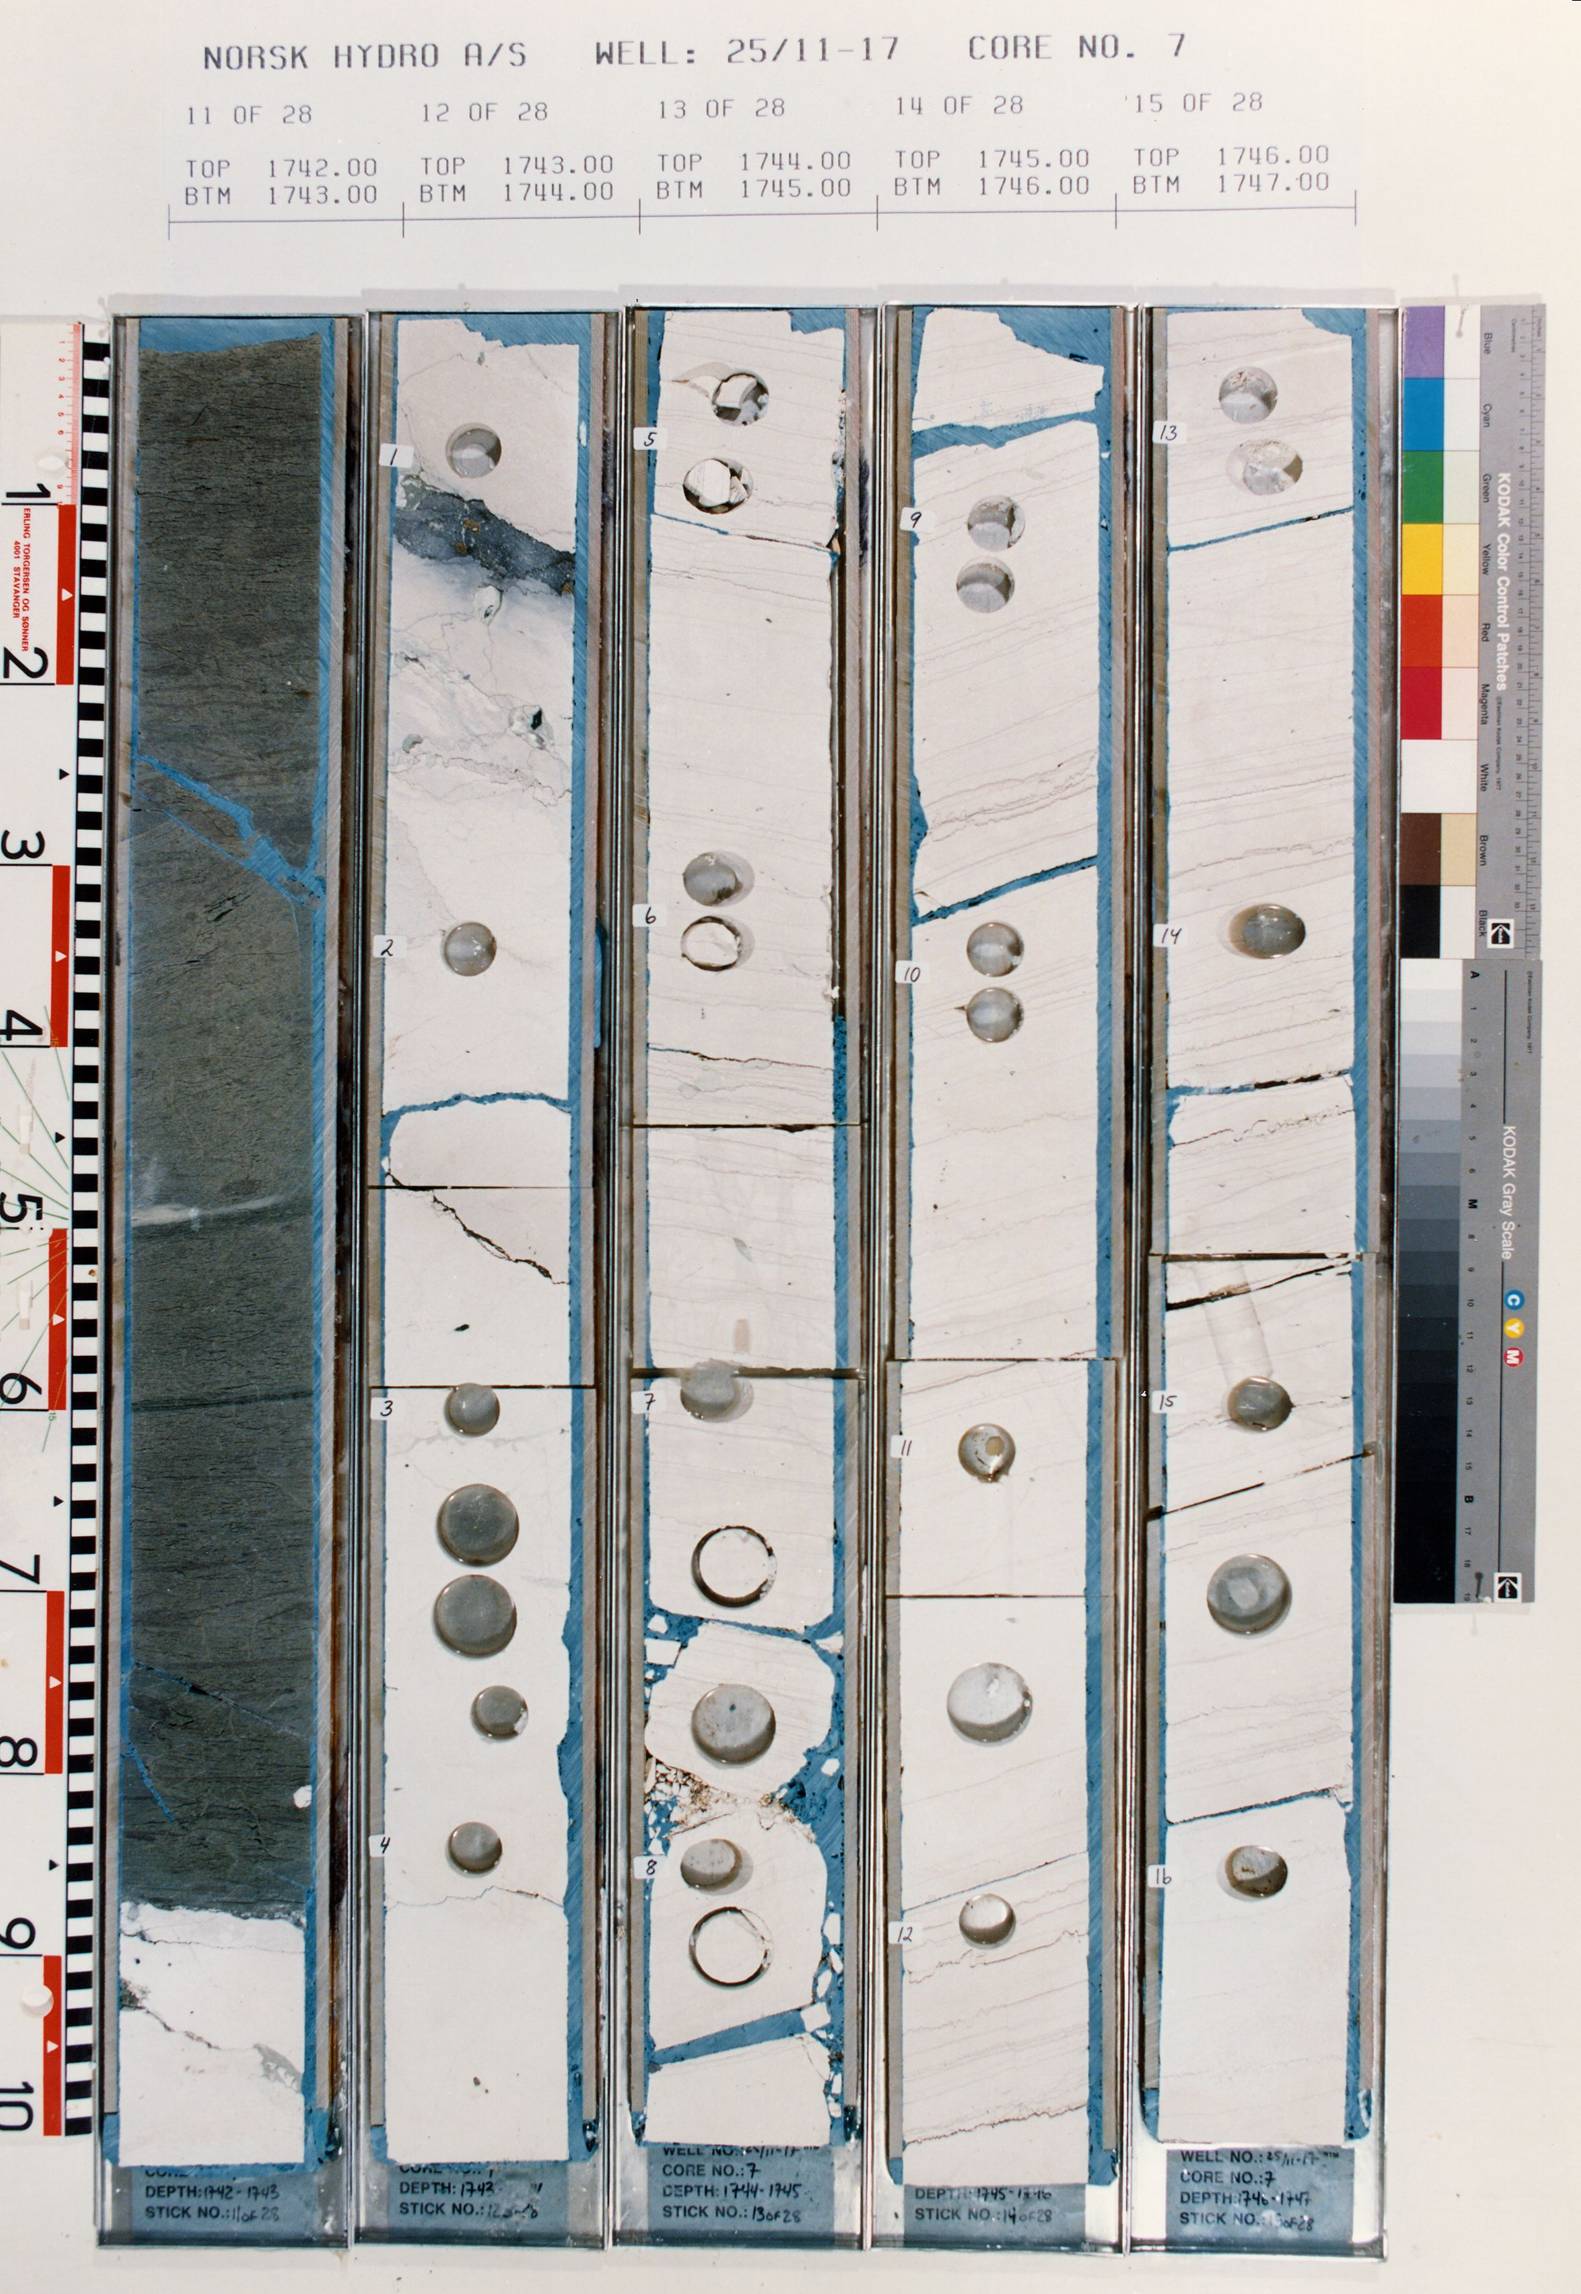
Fig. 7. Showing the unconformity at the base of the Rogaland Group, with the Vĺle formation resting on the chalk of the Shetland Group. Example is taken from Well 25/11-17 drilled by Norsk Hydro. Photo from NPD faktasider at http://www.npd.no. |
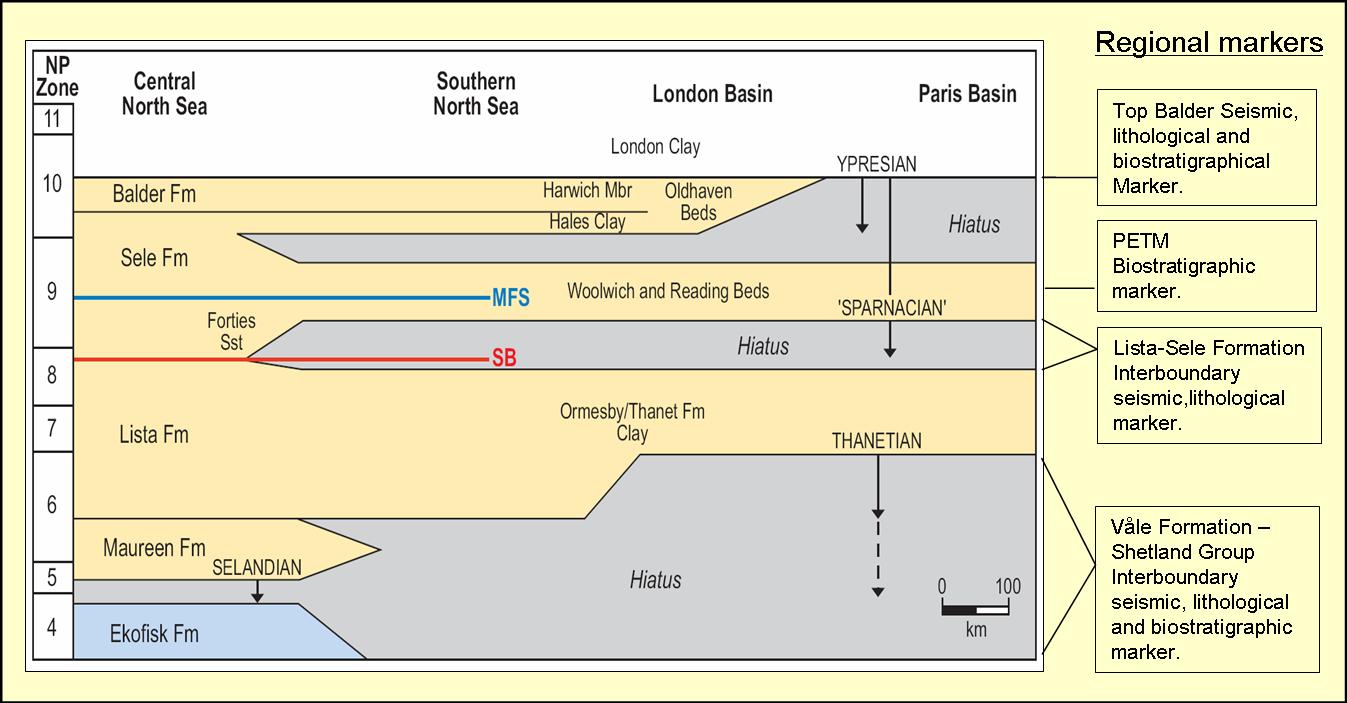
Fig. 8. Chronostratigraphic chart, modified after Knox (1994) for the Paleogene of the North Sea-Paris Basin region, showing that the type areas of the Paris Basin, the Ypresian and Thanetian stages, are bounded by unconformities. To capture the missing time represented by these unconformities, the stages could be expanded downward to incorporate the time represented by the basinal sediments of the Central and Northern North Sea Basin where there is continuous deposition. Modified from Simmons et al. (2007). |
The overall fall in sea level for Southern England is inferred as being at least 100 m. In Bradwell (Knox et al. 1994), the results of this sea level drop can be seen as an interval of fine grained marine mudstones of the Rhabdamina biofacies (Thanet Formation, Lista equivalent), overlain by the pedogenically altered continental to lagoonal Reading Formation, Sele Fm equivalent. At the Isle of Wight, offshore South England (Fig. 9) , the pedogenically influenced strata of the Reading Formation are seen to lie unconformably between marine sediments of the Shetland Group and the London Clay Formation (time equivalent to the Balder Formation). Knox (1996) and Neal (1996) argue that a sea level fall of a magnitude and rapidity to have caused this effect must be related to tectonical uplift. Ziegler (1988) and Ahmadi et al. (2003) infer that inversion tectonics has influenced the Southern and Central parts of the North Sea Basin, whereas e.g. Nilsen et al. (2005) also demonstrate substantial inversion along the Tornquist line and in the Norwegian Danish Basin during the Paleocene. From France and Belgium there is documented inversion of the Brabant Massif and the Artois Axis (Vandenberghe et al. 1998). For reference, see Fig. 4.

Fig. 9. Exposure of the Reading Formattion at Whitecliff Bay, Isle of Wight. As can be seen, the terrestrial sediments of the Reading Formation can lie inconformably between marine sediments, and must represent a dramatic sea level drop relative to the adjacent sediments (Photo by H. Brunstad). |
According to Simmons et al. (2007) the Sele-Lista Formation interboundary is present as an unconformity as far as the southern part of the Central North Sea (Fig. 8) , and Dreyer et al. (2004) report shallow marine indicators within the overall deep marine sandstones of the Latest Thanetian Forties Member in the Pierce and the Josephine High areas. These shallow marine indicators could be a result of local tectonics/salt tectonics, but could also as well be explained as a result of more regional causes, reflecting the large scale inversion related sea level drop as mentioned above.
In the sediments from the Central and Northern North Sea can be seen an abrupt transition from bioturbated to practically undisturbed dark shales. This transition is due to the above mentioned anoxia, lasting through deposition of the entire Sele and Balder Formations, ending with the deposition of the green and red coloured bioturbated shales of the Hordaland Group. Both top and base boundaries of this anoxic shale zone are sharp and considered to be very good litho- and chronostratigraphic markers. In the Central to Northern North Sea the basal part of this zone represents the correlative conformity to the subregional unconformity seen at the base of the Reading Formation in the London Basin and at the Isle of Wight, and in the South to Central North Sea.
The Sele-Lista Formation interboundary thus seems to represent an unconformity in the Southern North Sea and along the east and west margins of the basin further north, and a correlative conformity in the basinal areas from the Central North Sea and northwards. This interboundary is one of the best regional stratigraphic markers, easily detectable from seismic, lithology and biostratigraphy.
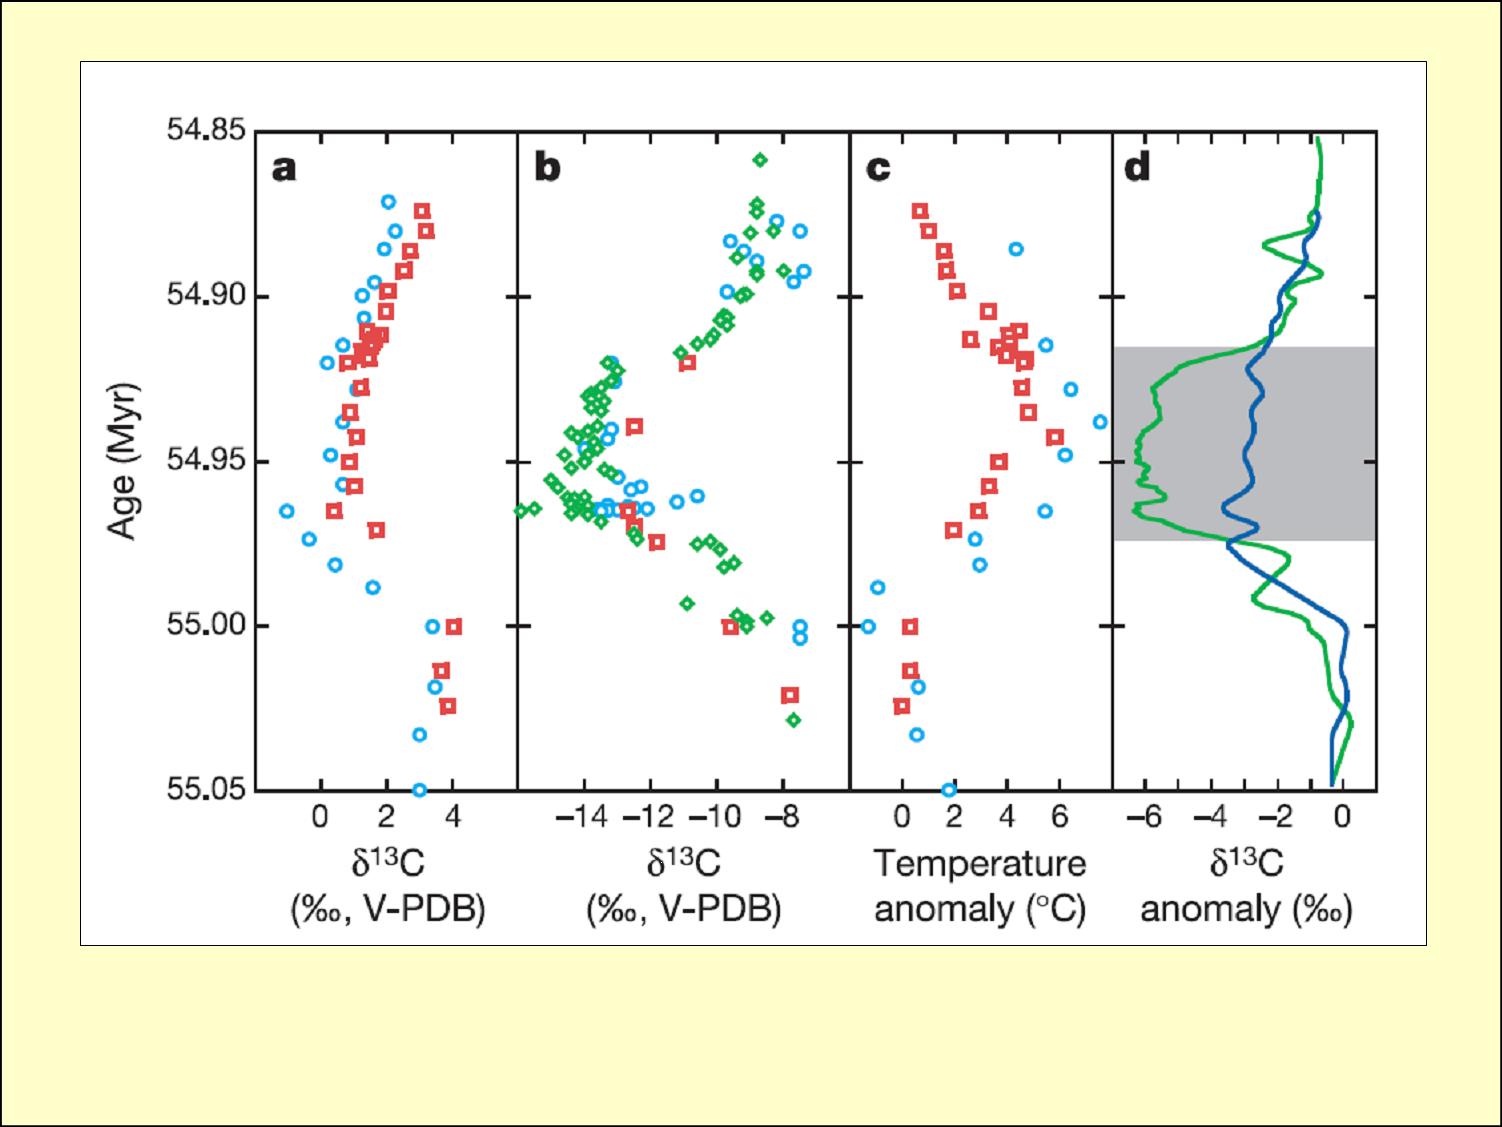
Fig. 10. Marine and Terrestrial records of the PETM, correlated to an age model for ODP site 690 (Antarctic Ocean). a) Marine d13C records derived from the surface dwelling genus Acarania at ODP sites 690 (Antarctic, blue circles) and 1290 (subtropical Pacific Ocean, red squares). b) Paleosol carbonates d13C from northern Spain (Blue circles), Hunan, Chona (red squares) and Wyoming, USA (green diamonds). c) Temperature anomalies for sites 690 and 1209 calculated from monospecific d18O and Mg/Ca records, respectively (symbols in a.). d) normalized composite carbon isotope curves for paleosol carbonates (green) and planktonic foraminiferal carbonate (dark blue). Interval of terrestrial CIE amplification (PETM temperature increase) is shown in grey. From Bowen et al., 2004. |
With its short time duration, the PETM is almost a perfect chronostratigraphic marker. However, the definition of this stratigraphic event is not possible macroscopically, and must rely on high resolution biostratigraphic analysis with dense sampling.
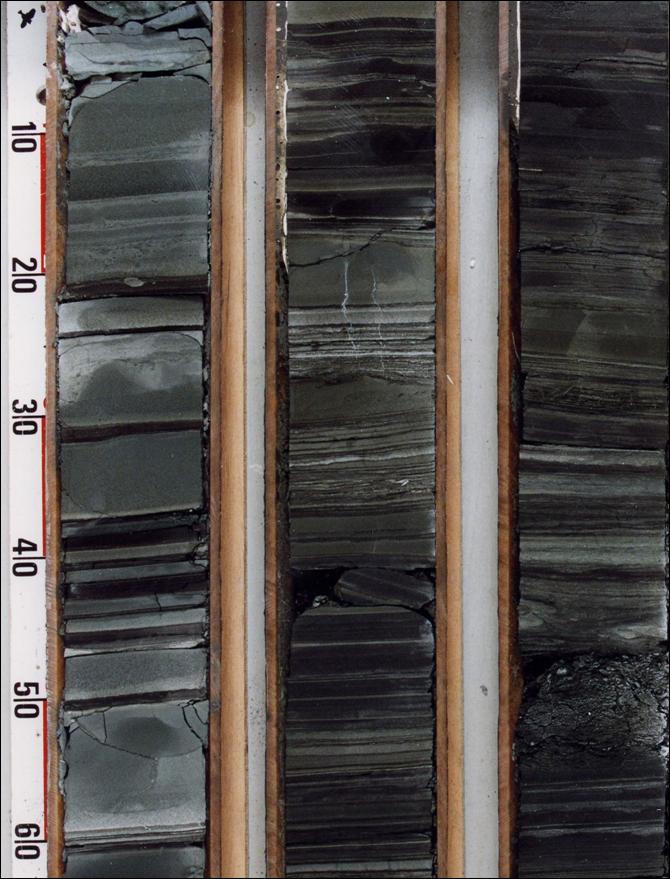
Fig.11 Series of bright to medium dark greenish grey tuff layers of variable thickness, interlaminated with black anoxic shales. Example is taken from the Balder Formation Well 25/11-20 drilled by Norsk Hydro. Picture from NPD Faktaside at http://www.npd.no. |
In broad terms, the Rogaland Group of this study corresponds with the formal definition by Hardt et al. in Isaksen & Tonstad (1989), which authors joined Deegan & Scull's (1977) Montrose and Moray Groups into the single Rogaland Group.
In this study, the finer siliciclastic formation units remain as previously defined, but the sandstone formations of Hardt et al. (1989) are changed into members. This procedure follows much of the same principle as in Mudge & Copestake (1992) and Knox & Holloway (1992) for the UK sector of the North Sea.
Since Hardt et al.'s (1989) work on the Norwegian sector, an abundance of new stratigraphic information from wells and 3D seismic has become available. The data have shown a more complex situation concerning sand provenance and sand distribution. The geographic distribution of the sand units has been refined. The stratigraphic resolution using microfossils has also become more detailed.
As a result, several new member names have been introduced in the period after Hardt et al.'s (1989) revision (Knox & Holloway, 1992; Ahmadi et al., 2003; Schiřler et al., 2007) and are used here. In addition, new members are proposed in this study, and several type and reference wells originally defined by Hardt et al. (1989) have been amended. Several additional wells are also added when new stratigraphic units are established. This study also provides comprehensive geological figures of the new members.
In the current revision of the Rogaland Group, it is intended to use existing naming as far as practical for the sandstone members. However, some major additions have been made in the North Eastern North Sea and in the Siri Canyon of the southern parts of the Norwegian Danish Basin since the former official nomenclature (Hardt et al., 1989) did not describe any sandstones there. Since the 90s several wells have given more information about sandstones in these areas and they are correspondingly included and defined here.
The fifteen sandstone members of the Rogaland Group have been defined according to their provenance area, sedimentary distribution and structural boundaries. This practice has been used by: Hardt et al. (1989) to separate their easterly derived 'Fiskebank Formation' from the westerly sourced 'Forties Formation'; Schiřler et al. (2007) to separate easterly sourced sandstones of the Siri Canyon and Tail End Graben/Sřgne Graben from westerly sourced sandstones of the Central Graben; and Hardt et al. (1989) and Knox and Holloway (1992), distinguishing northwestern from southwestern sandstones in the Central Graben and the Viking Graben.
Roughly, sandstone members within each shale formation are bounded by the two crossing Member separation lines shown in Figs. 12 and 13, which give four sub areas each with their separate sandstone member:
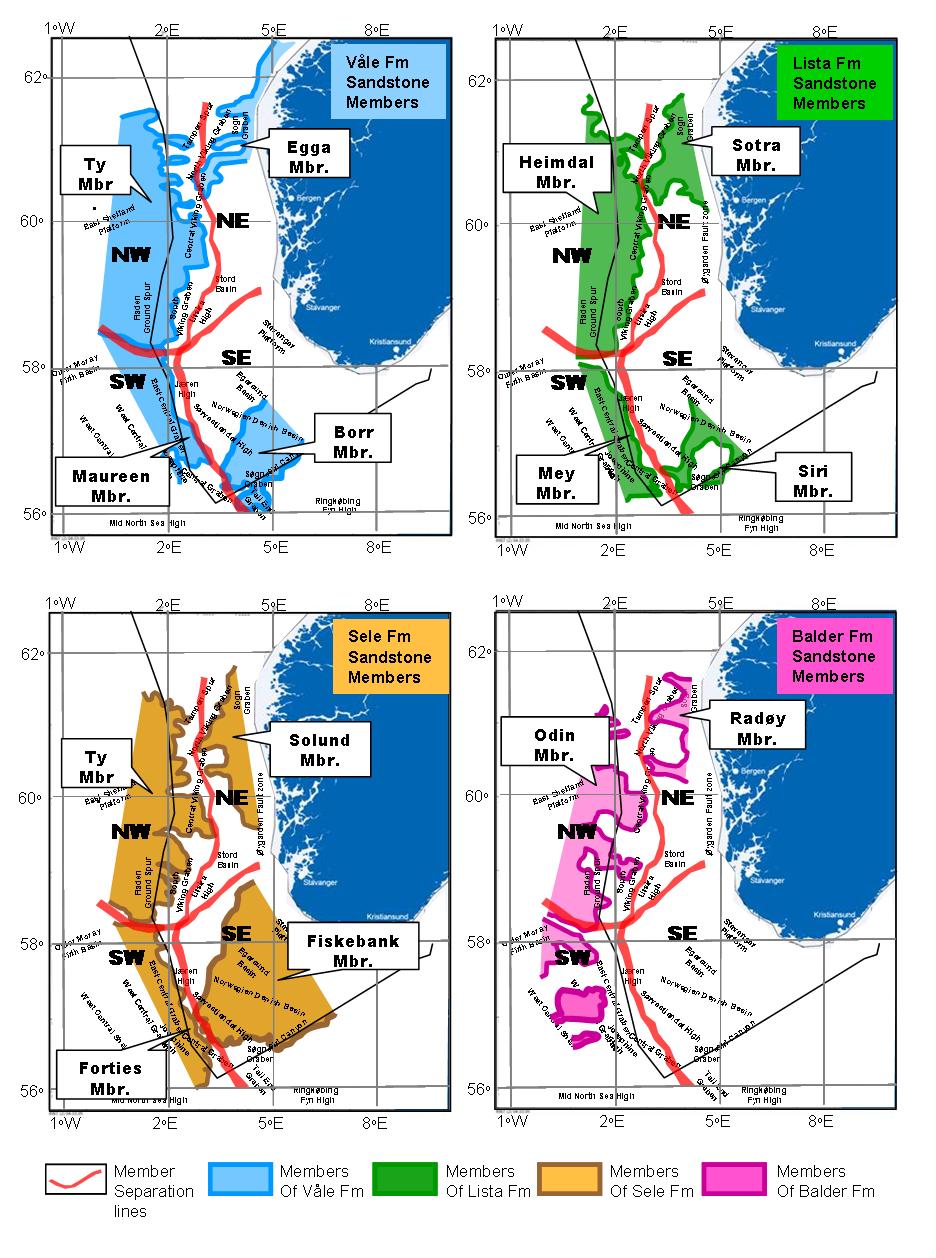
Fig. 12. Sketch showing rough distribution of the sandstone members belonging to the four shale formations of the Rogaland Group, relative to the Member separation lines. |
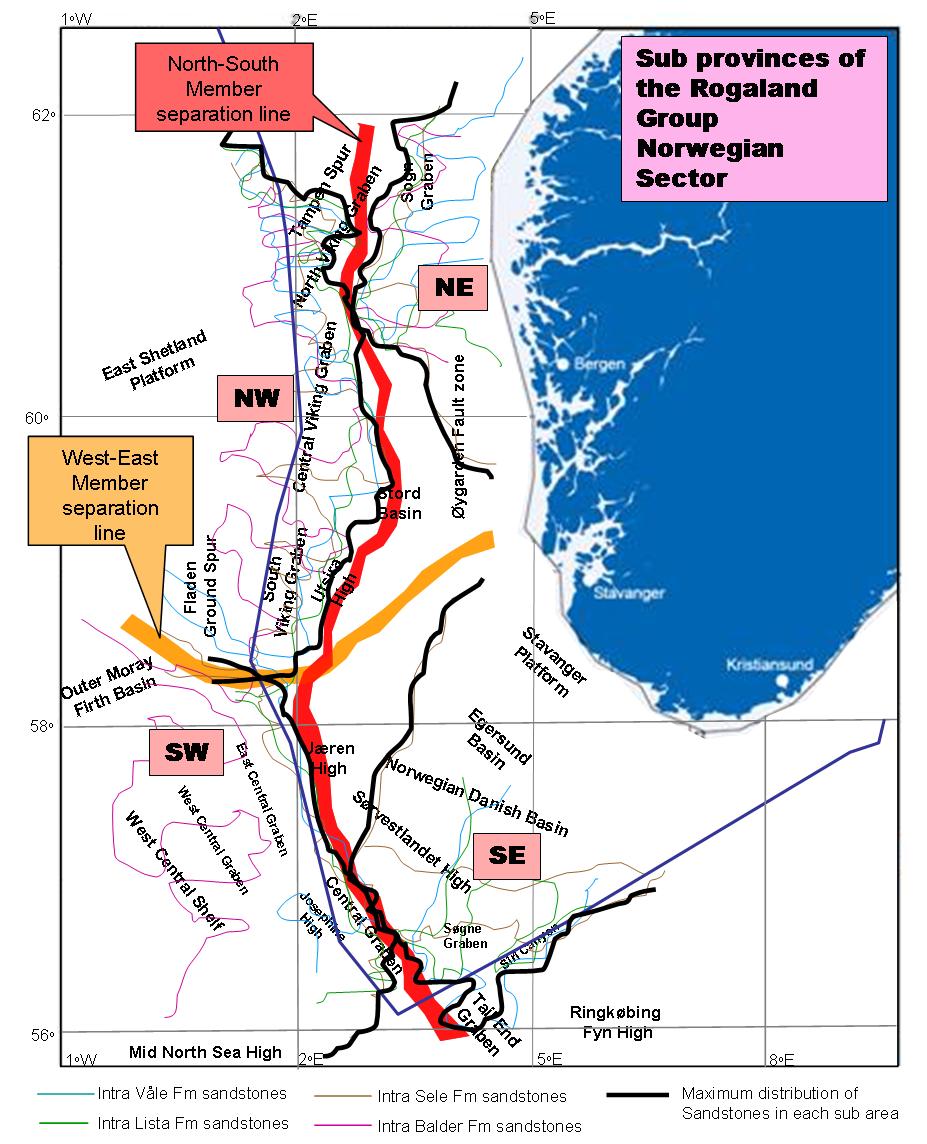
Fig. 13. Sketch demonstrating subareas and separation lines used to limit the various sandstone members. |
In general the shale formations are described in more detail concerning biostratigraphic events and stratigraphic criterias, and in the descriptions of the sandstones members it is often referred back to the shale formation concerning this issue.
A large amount of composite well diagrams have been designed, and are shown under the various stratigraphic units. The lithological codes used are shown in Fig. 14.
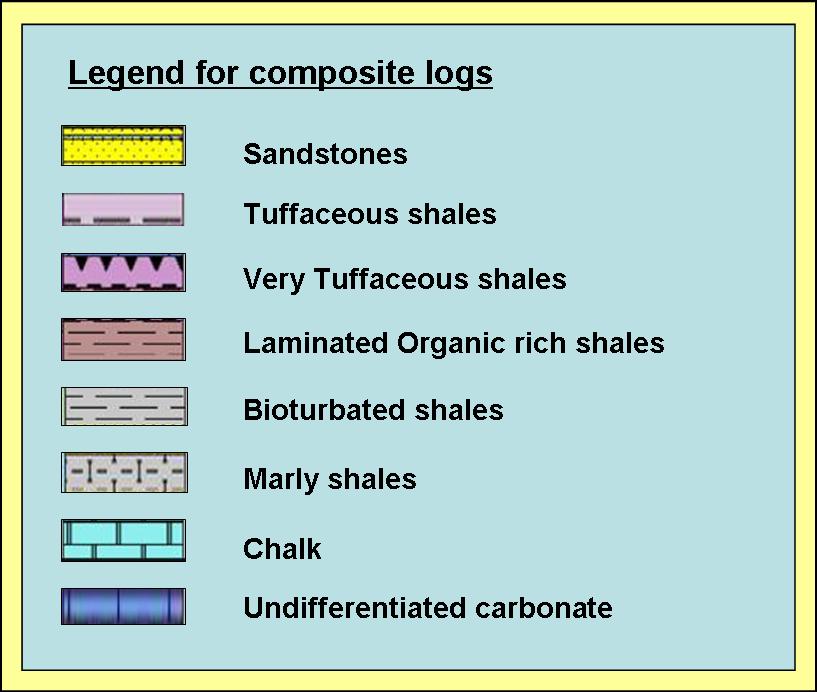
Fig. 14. Lithological codes used in well composites in Chapter 4-7. |
The formations in this lithostratigraphic revision are defined geographically to include the main shale units of the Paleocene and Early Eocene of the North Sea up to 62°N.
An overview of the Rogaland Group with its four shale formations and seventeen sandstone members is shown in Fig. 15.
Fig. 15. Lithostratigraphic summary chart of the Rogaland Group, Northern and Central North Sea.
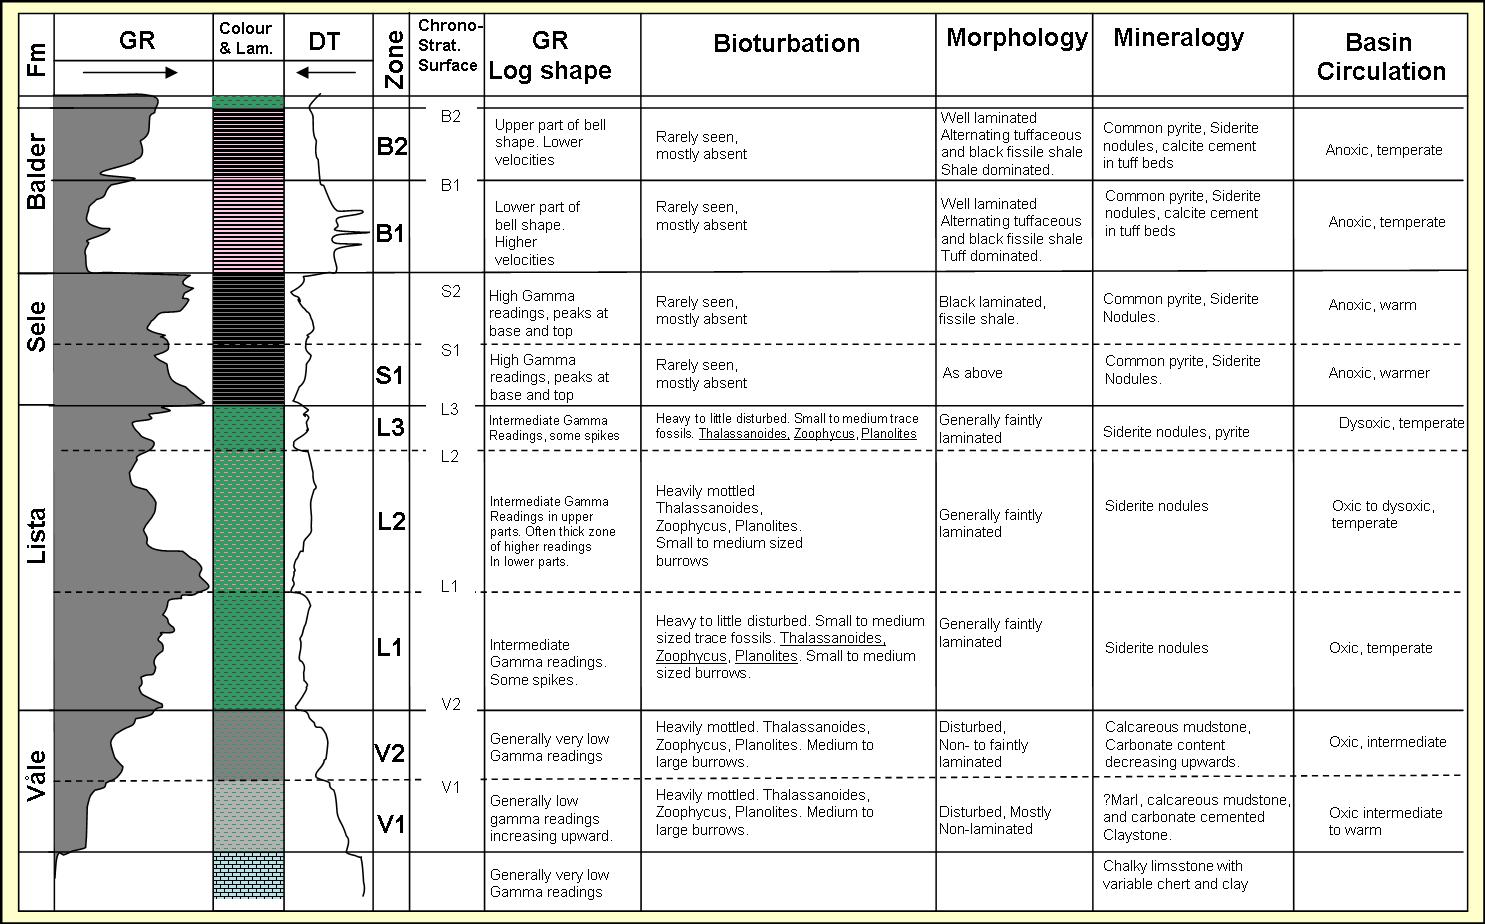
Table 2. High resolution shale stratigraphy of an idealized desanded log of the Rogaland Group in the Viking Graben. |
Isochore map ROGALAND-SHETLAND from well data
The top of the Rogaland Group is often distinguishable as the top Balder seismic reflector. However, in some areas the top of the Balder tuffaceous zone or the base of the Balder Formation are better defined than the formation top, and is often easier to map regionally.

Fig. 16. Regional seismic line I, northern North Sea. Note signs of dipping reflections/shelf buildout in the East Shetland basin, and dipping reflections representing slope wedges in the Horda Platform area. In the basinal area between the wedges there are thin deposits, reflecting a relatively sparse input of gravity flow material in that area compared to the South Viking Graben and the Central Graben. |
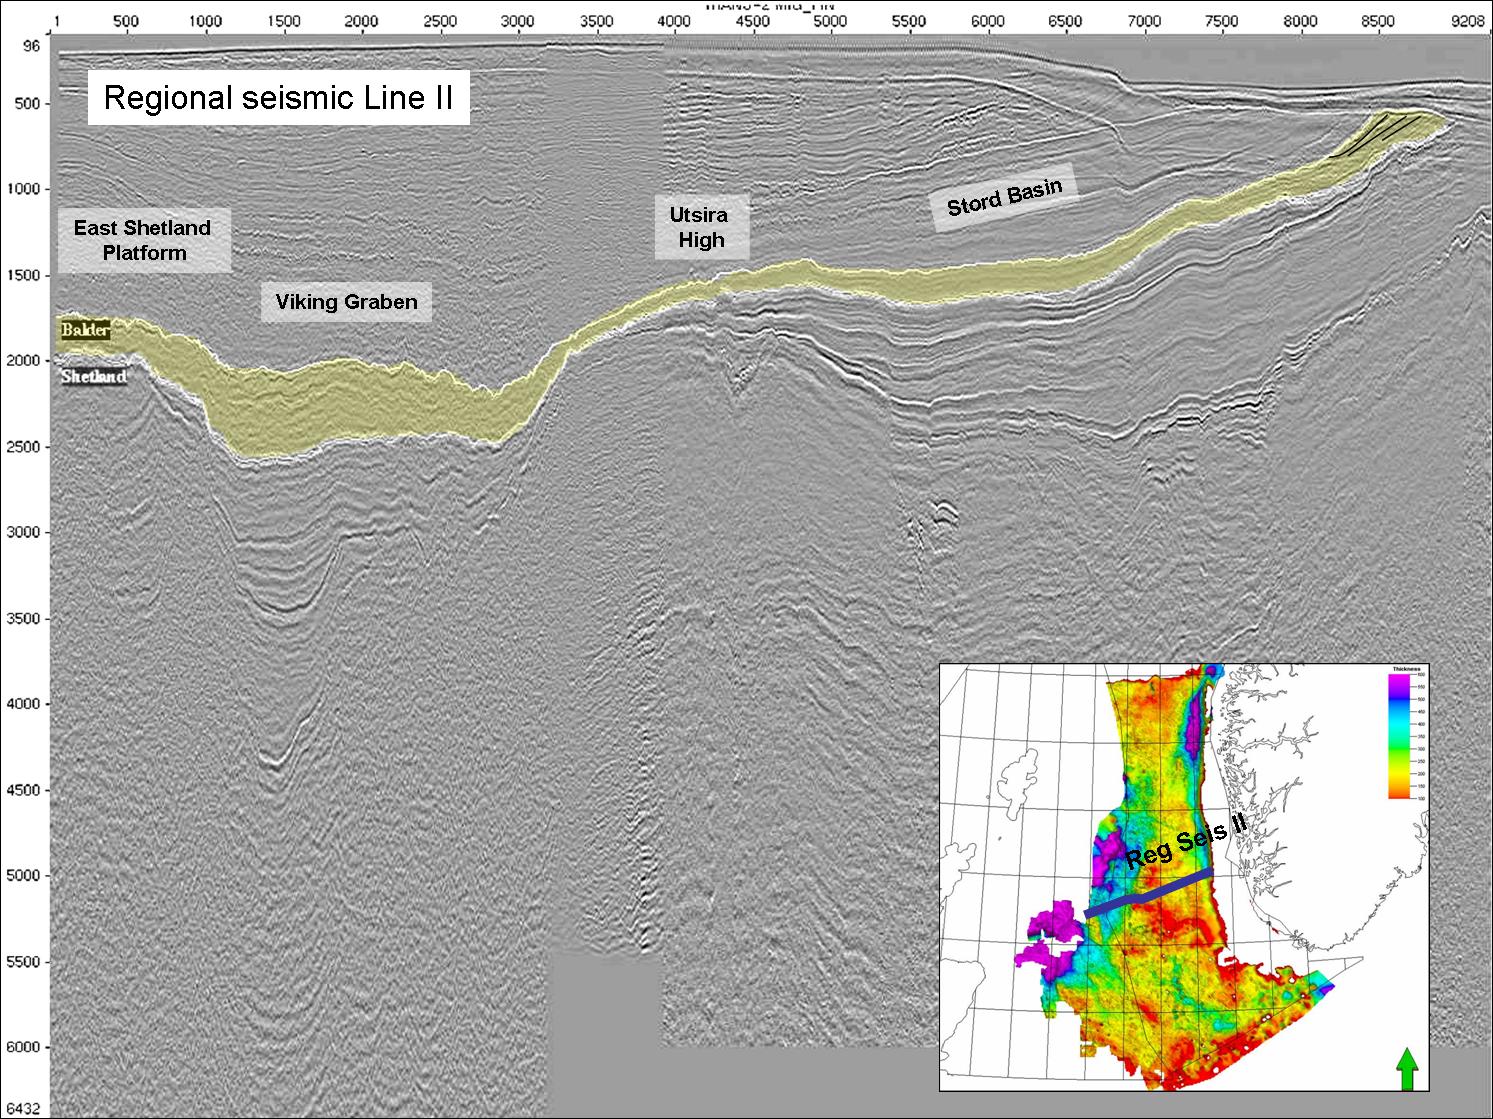
Fig. 17. Regional seismic line II, from the Shetland Platform to the Stord Basin, North Sea. Dipping reflections east of the Stord Basin are attributed to slope progradation from the East. The Viking Graben formed a deep basin filled with a mixture of gravity flow sediments sourced from the East Shetland Platform and background hemipelagic siliciclastics. Utsira High is characterized by a thinning of the sequence, and is believed to have formed a submarine basinal high during deposition. |
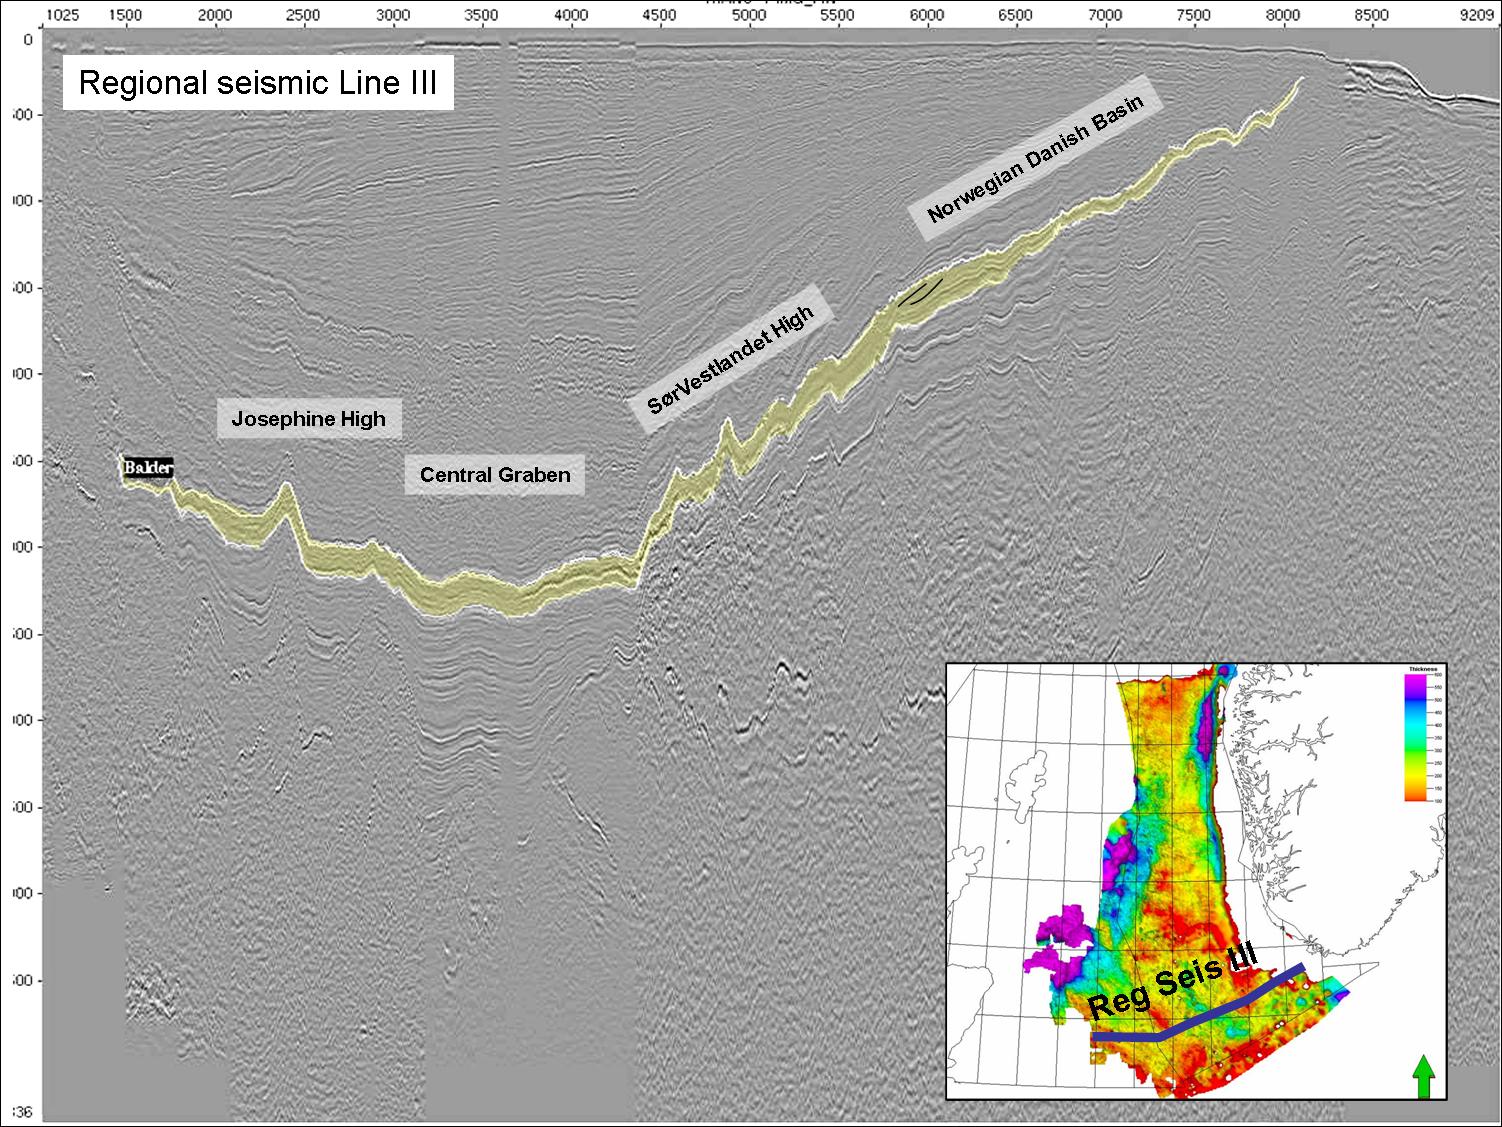
Fig. 18. Regional seismic line III, through the Central Graben and the Norwegian Danish Basin, North Sea. Thickening in the Central Graben is mainly attributed to input of siliciclastics from the East Shetland Platform and the Moray Firth area in the north, but input from Southern Fennoscandia in the east and possibly the Midland Valley area may also have contributed. The Central Graben area is commonly interpreted as a deep marine environment, whereas the Norwegian Danish Basin is considered as a shallow to deep marine transition. |

Fig. 19. Example of seismic character of sandy facies of the Rogaland Group, seen from a WE section through southern parts of block 25/10. |
The most pronounced deep marine sandstones are found along the trends of the Central Trough - Viking Graben and the Sogn Graben. On the East Shetland platform (UK), sandstones intercalated with shales and well developed coals or lignitic beds witness deltaic/coastal plain setting. Distinct coal beds are not found in wells penetrating the Rogaland Group of the Norwegian North Sea.
Most wells in the Norwegian sector have been drilled in a paleo-slope to basin floor setting and sandstones here are in general interpreted as gravity flow/turbidites of submarine fans (e.g. Hardt et al., 1989, Knox & Holloway, 1992). Possible exceptions include some occurrences of the intra Sele Formation sandstones of the Forties (Dreyer et al., 2004) and Fiskebank Members. This is discussed in more detail in the subchapters on these members. A nice seismic scale example of submarine fan deposits is shown in the seismic amplitude map in Fig. 20. Examples of turbidites in cores from the Rogaland Group are shown in Figs. 21-24.
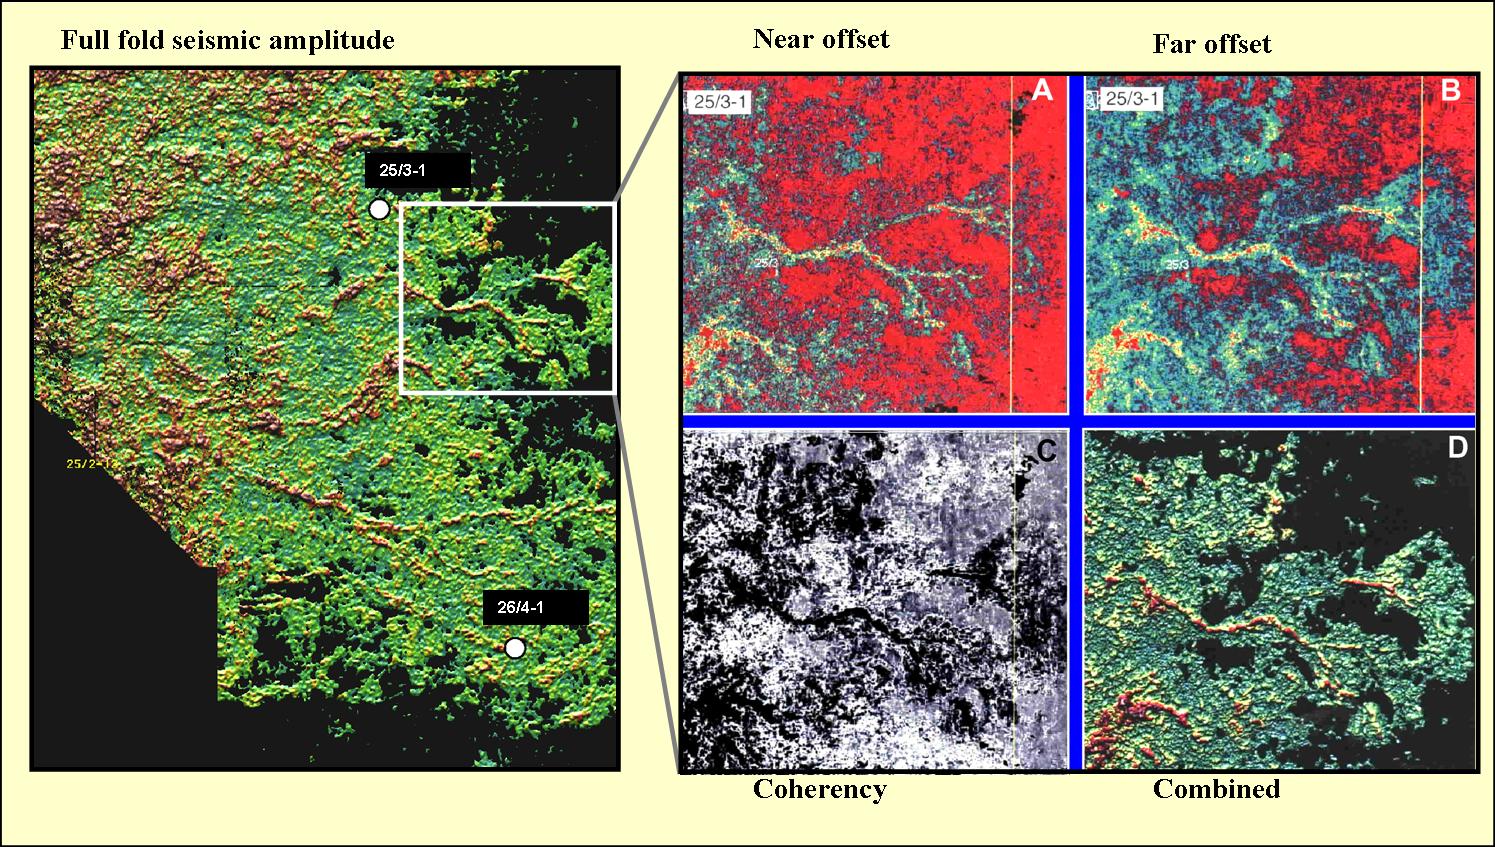
Fig. 20. Seismic amplitude maps of an intra Sele Formation seismic marker, displaying submarine fan deposits of the Hermod Member in north eastern parts of Q25. |
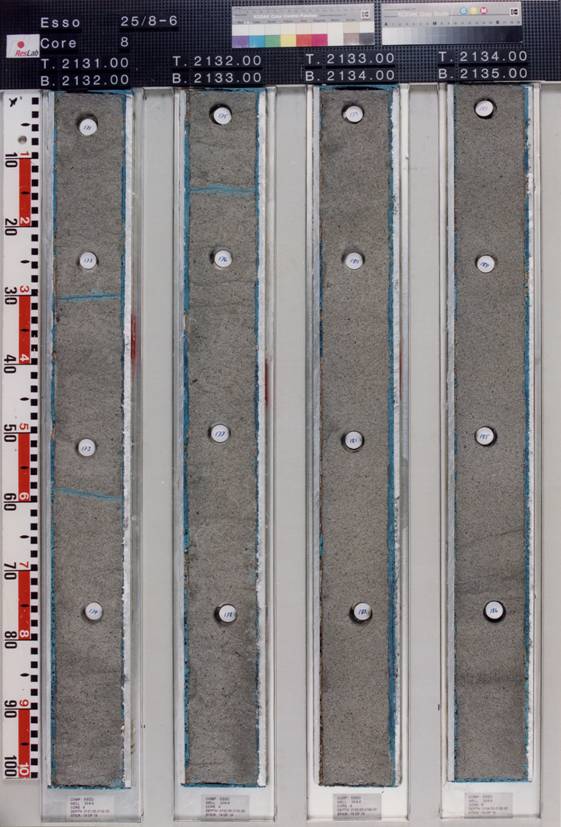
Fig. 21. Turbidite Example 1. Clean, massive sandstones in Heimdal Member well 25/8-6, interpreted as high density turbidites. Picture from NPD fact pages at http://www.npd.no. |
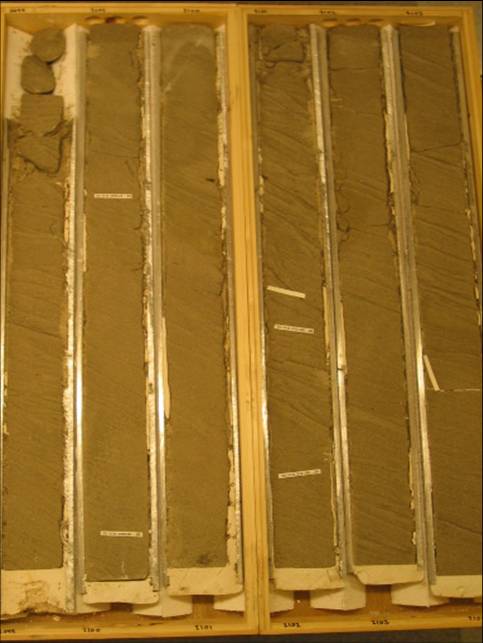
Fig. 22. Turbidite Example 2. Dish structured massive sandstone in Heimdal Member well 25/10-7, interpreted as high density turbidites influenced by water escape after deposition. Picture by H. Brunstad. |
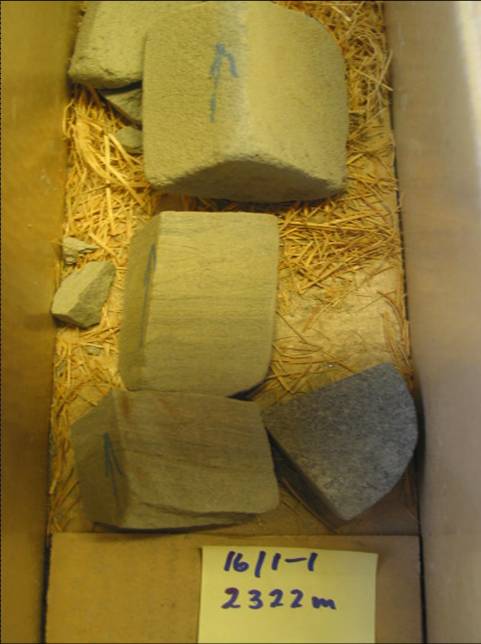
Fig. 23. Turbidite Example 3. Normal graded beds, with sharp base and massive structureless sandstone in lower parts of beds, and faintly cross laminated sandstones in the upper parts. Example from Heimdal Member, well 16/1-1. Deposits are interpreted as low-density turbidite deposited in a distal fan or overbank position. Picture by H. Brunstad. |
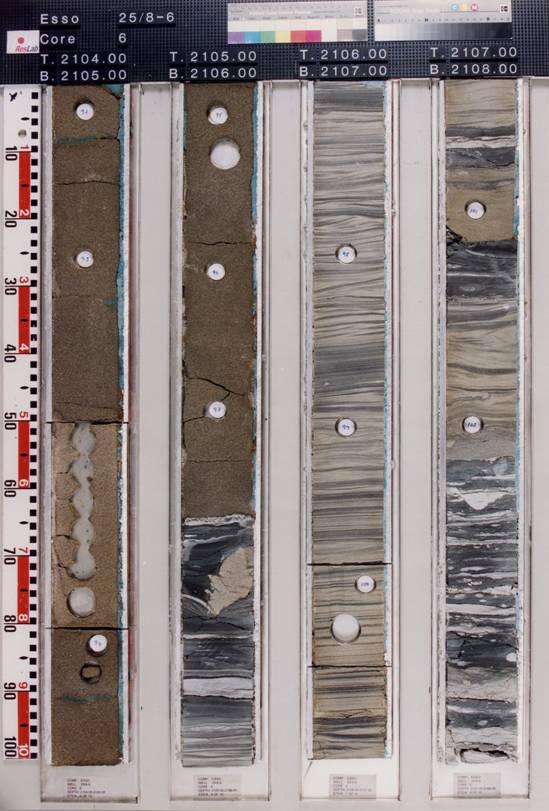
Fig. 24. Turbidite Example 4. Beds of clean, massive, structure-less sandstone at top, and thin-bedded, ripple cross laminated, heterolithic sandstones below. Massive sandstone is interpreted as high density turbidite deposited in a proximal/axial fan position, whereas heterolithics are interpreted as low density turbidites deposited in a fan fringe position. Example from Heimdal member, well 25/8-6. Picture from NPD fact pages at http://www.npd.no. |
There is a great variability in the composition of the turbidites. Some consist of thick beds of massive sandstones with frequent fluid escape structures and only very sparse primary structures (Figs. 21 and 22) . In other cases turbidites consist of interbedded shales and sandstone layers with primary structures as horizontal lamination and ripple cross bedding (Figs. 23 and 24) .
In general, the sandstones have very fine to medium sized grains and are moderate to well sorted. Mineralogy is dominated by quartz and feldspar, although in some cases the sandstones may contain a large proportion of glauconite or mica grains. Rip-up clast material of clay and drifted wood fragments may be common in the sandstones in some areas, especially in lower parts of sandstone intervals.
Sandy debris flow deposits may also make up an important part of the primary deposited sandstones in some areas, consisting of massive, rather structureless sandstones, with variable content of fine grained clayey matrix and larger angular mudstone clasts. In the sandstones of the Maureen and Mey Members of the Central Trough, and the Ty Member of the Viking Graben, chalk clasts and occasional chert clasts are also common within the sands. An example of sandy debris flow deposits is shown in Fig. 25.

Fig. 25. Example of sandy/gravelly debris flow deposits from the intra Lista Formation Mey Member. Cores are from well UK 30/14-1, Flyndre discovery, close to the UK/NOR border. The clast material consists of reworked chalk, mudstone, chert and sandstone. The sediments are matrix supported to grain supported. Photo by H. Brunstad. |
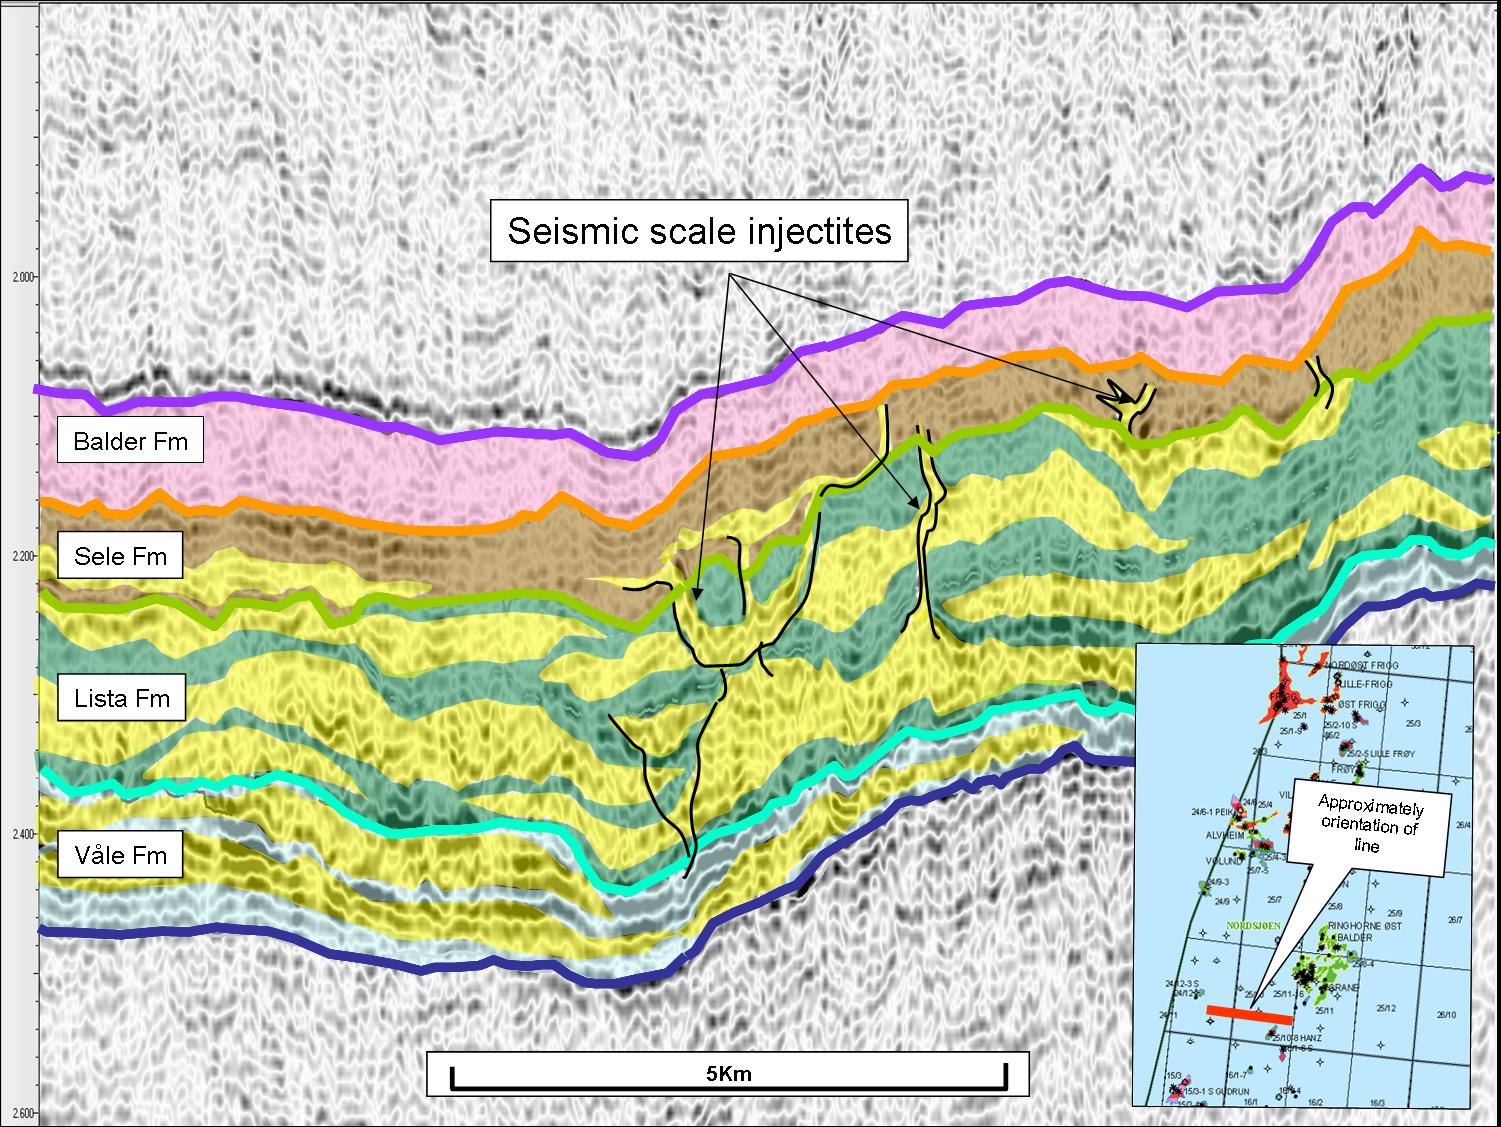
Fig. 26. Example of seismic scale injectite systems in the southern parts of block 25/10. |
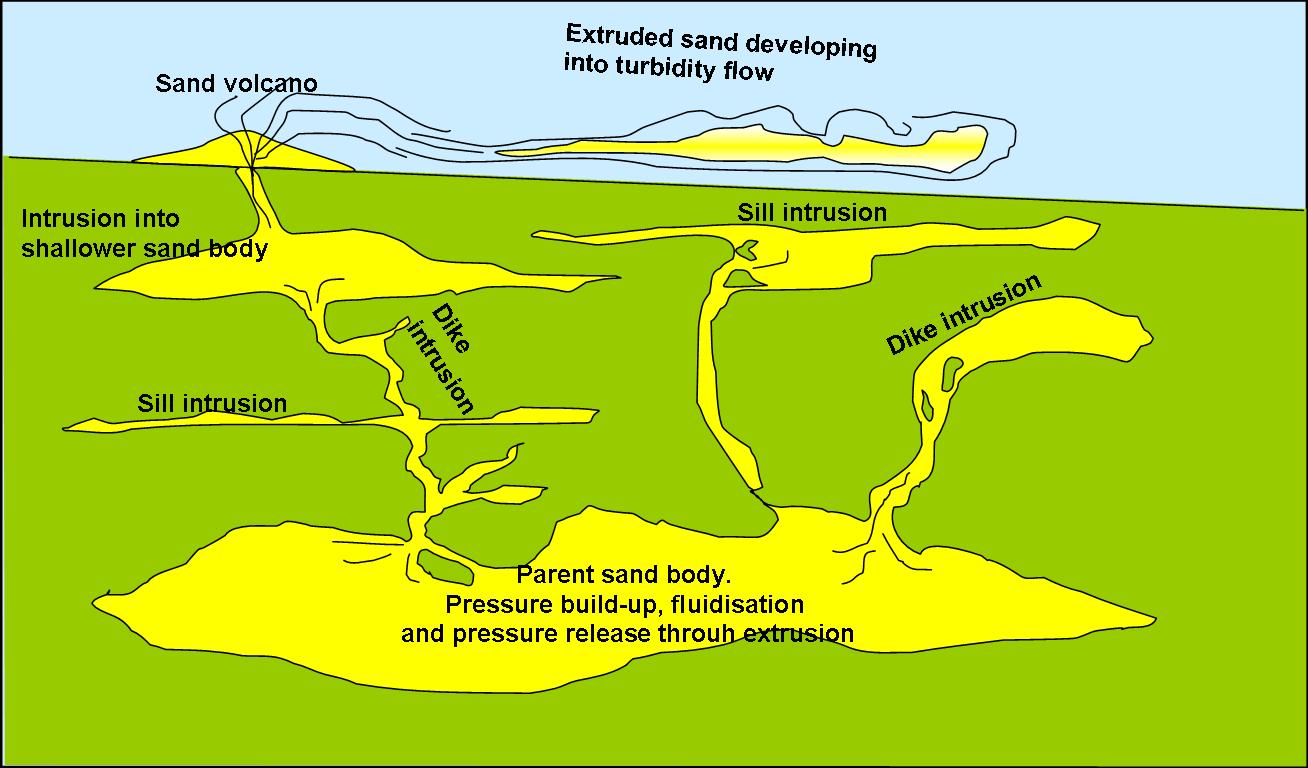
Fig. 27. Sketch showing various sand intrusion to extrusion types. |
Sand injectites are fluidized and mobilized sands that were injected into sediments, generating dikes and sill systems (Figs. 27, 28 and 29) , whereas sand extrusions were fluidized sands that extruded to sea bottom as sand volcanoes, sometimes developing into turbidites.
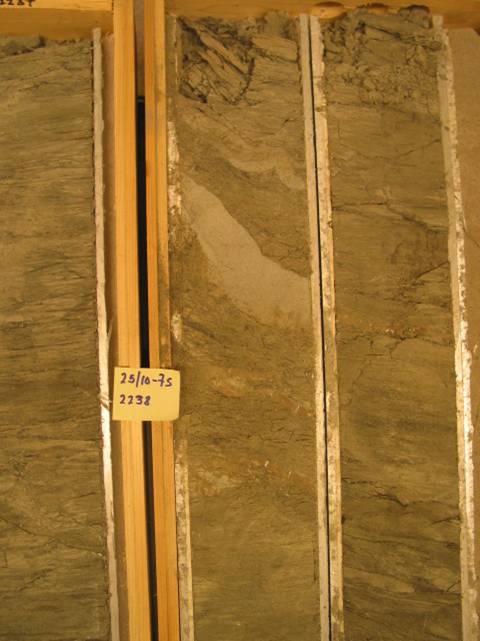
Fig. 28. Sandy dike injectites. Core example from the upper parts of the Lista Formation, well 25/10-7S. Photo by H. Brunstad. |

Fig. 29. Sandy sill injectite. Example from the Balder Formation well 25/11-23. Photo from NPD Fact pages on http://www.npd.no. |
Sand intrusion and extrusion is a result of pressure release and pressure reduction from overpressured sands through water escape and escape of fluidized sands from higher pressured areas to lower pressured areas. Most commonly this involved stratigraphical upwards movements of sands, but downwards and lateral movements also seem to have occurred. Simultaneously with sand injection there was severe sand deformation of parent and receiver sand bodies and clay clasts being ripped up from sand/mud interboundaries, both within the mother and the offspring sand bodies as well as in the sill/dike systems themselves.
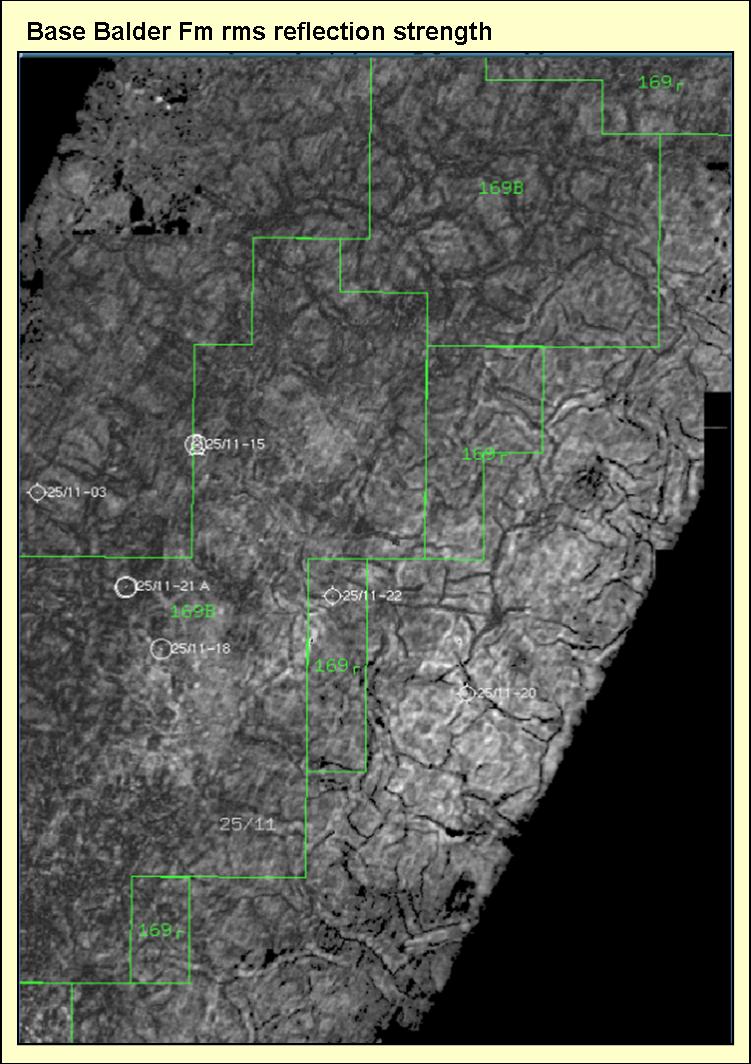
Fig. 30. Polygonal fault patterns seen from seismic amplitude map of the Base Balder Fm seismic surface in the Grane Area. |
According to Dewhurst et al., (1999) the structure and geometry of the fault system are controlled by the colloidal nature of the sediments, and the volumetric contraction measured on seismic scale can be accounted for by syneresis of colloidal smectitic gels during early compaction.
Syneresis results from the spontaneous contraction of a sedimentary gel without evaporation of the constituent pore fluid. This process occurs due to the domination of interparticle attractive forces in marine clays, dependent on environment, and is governed by the change of gel permeability and viscosity with progressive compaction. The process of syneresis can account for a number of structural features observed within the fault systems, such as tiers of faults, the location of maximum fault throw and growth components at upper fault tips (Dewhurst et al., 1999).
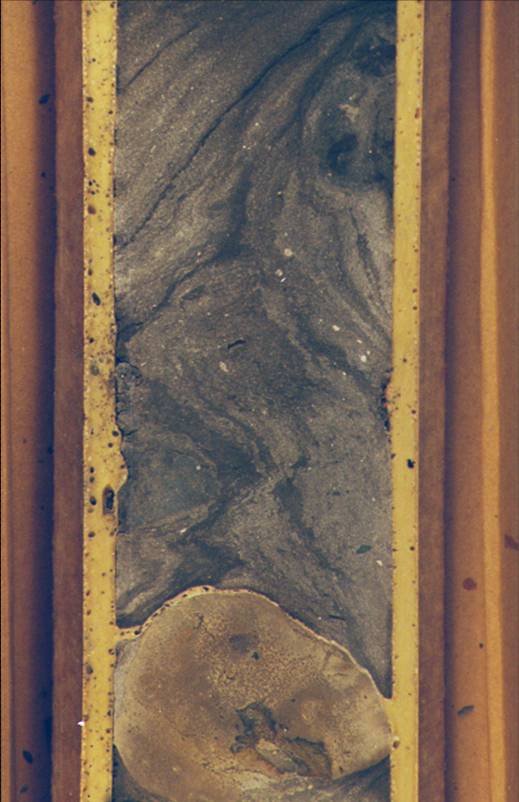
Fig. 31. Example of slump folded sediments. Example is taken from the Lista Formation from well UK30/14-1, Flyndre Discovery, close to the UK/NOR border. Photography by H. Brunstad. |
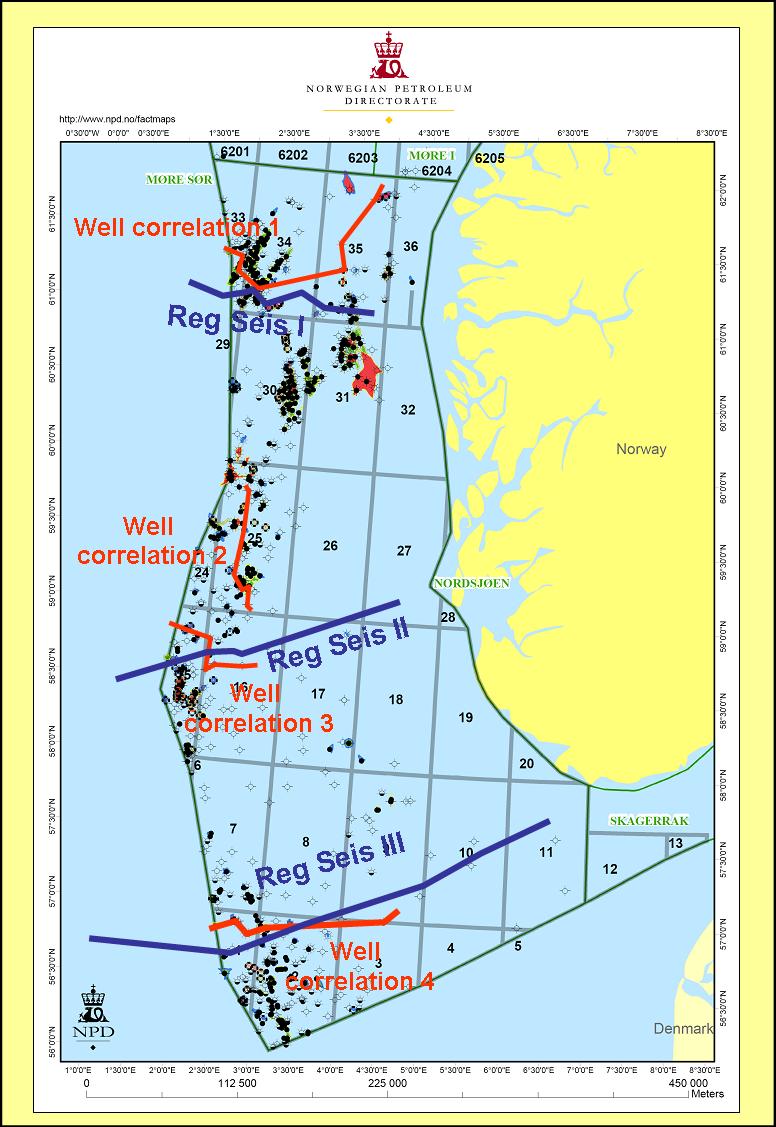
Fig. 32. Overview map showing orientation of Regional seismic lines I-III and well correlation lines 1-4. |

Fig. 33. Regional well correlation I, northern North Sea. |
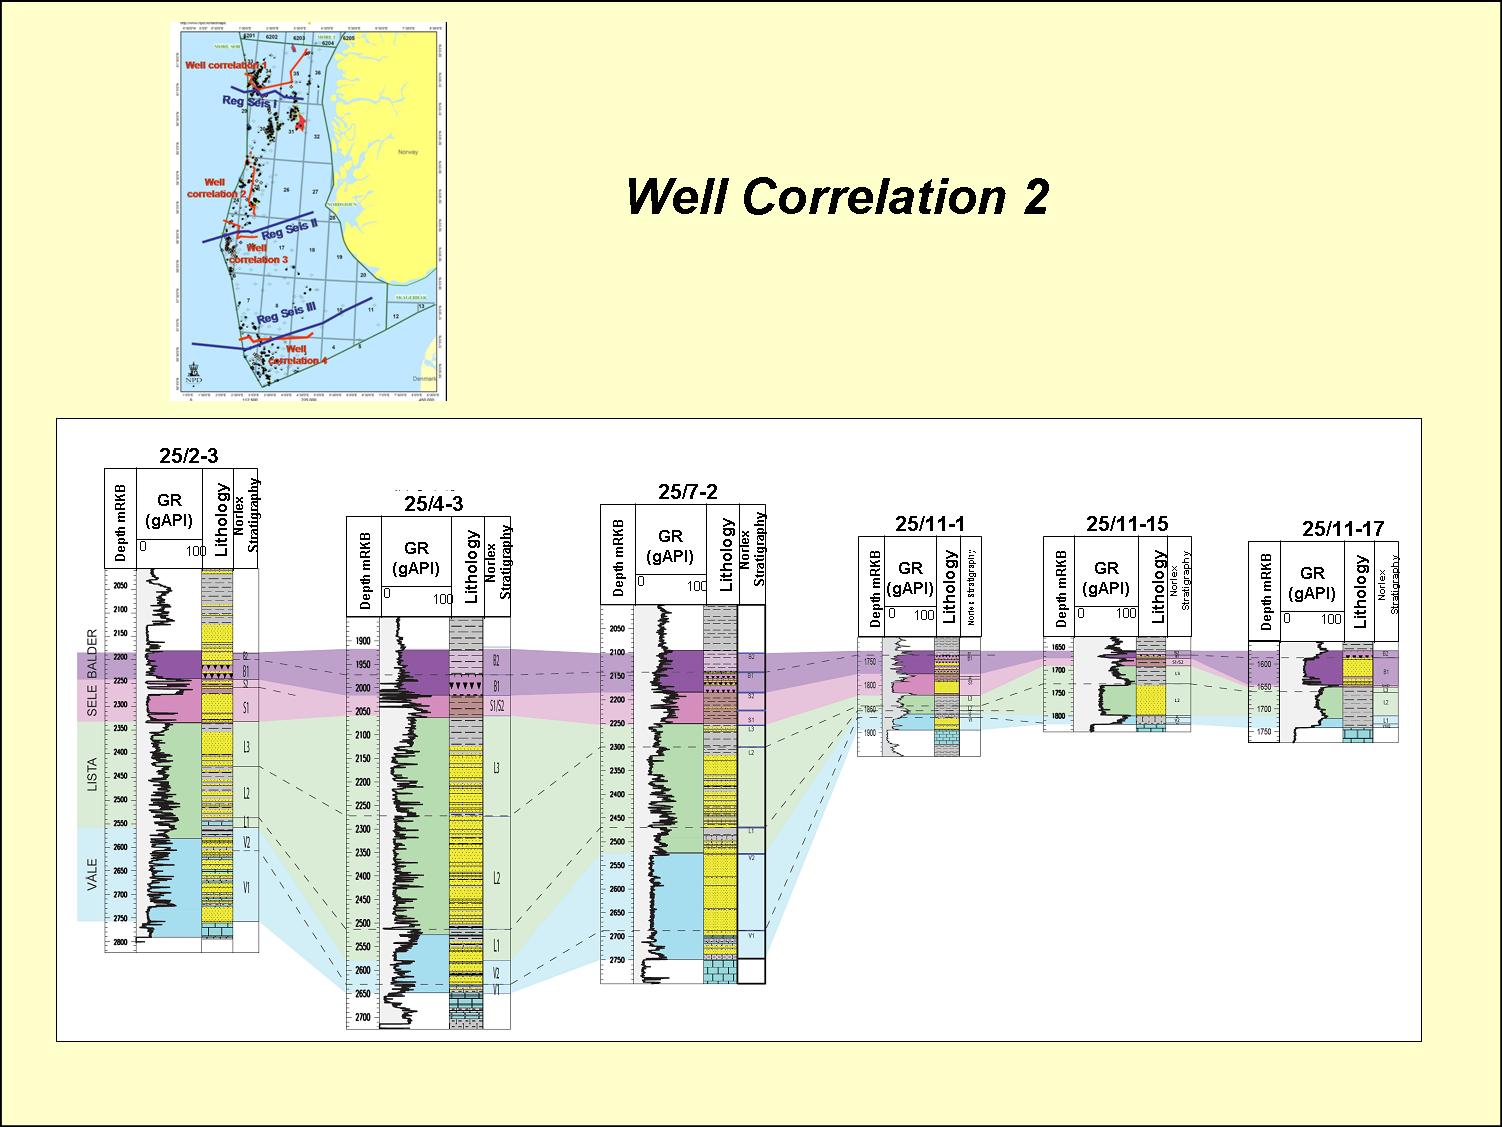
Fig. 34. Regional well correlation II. |
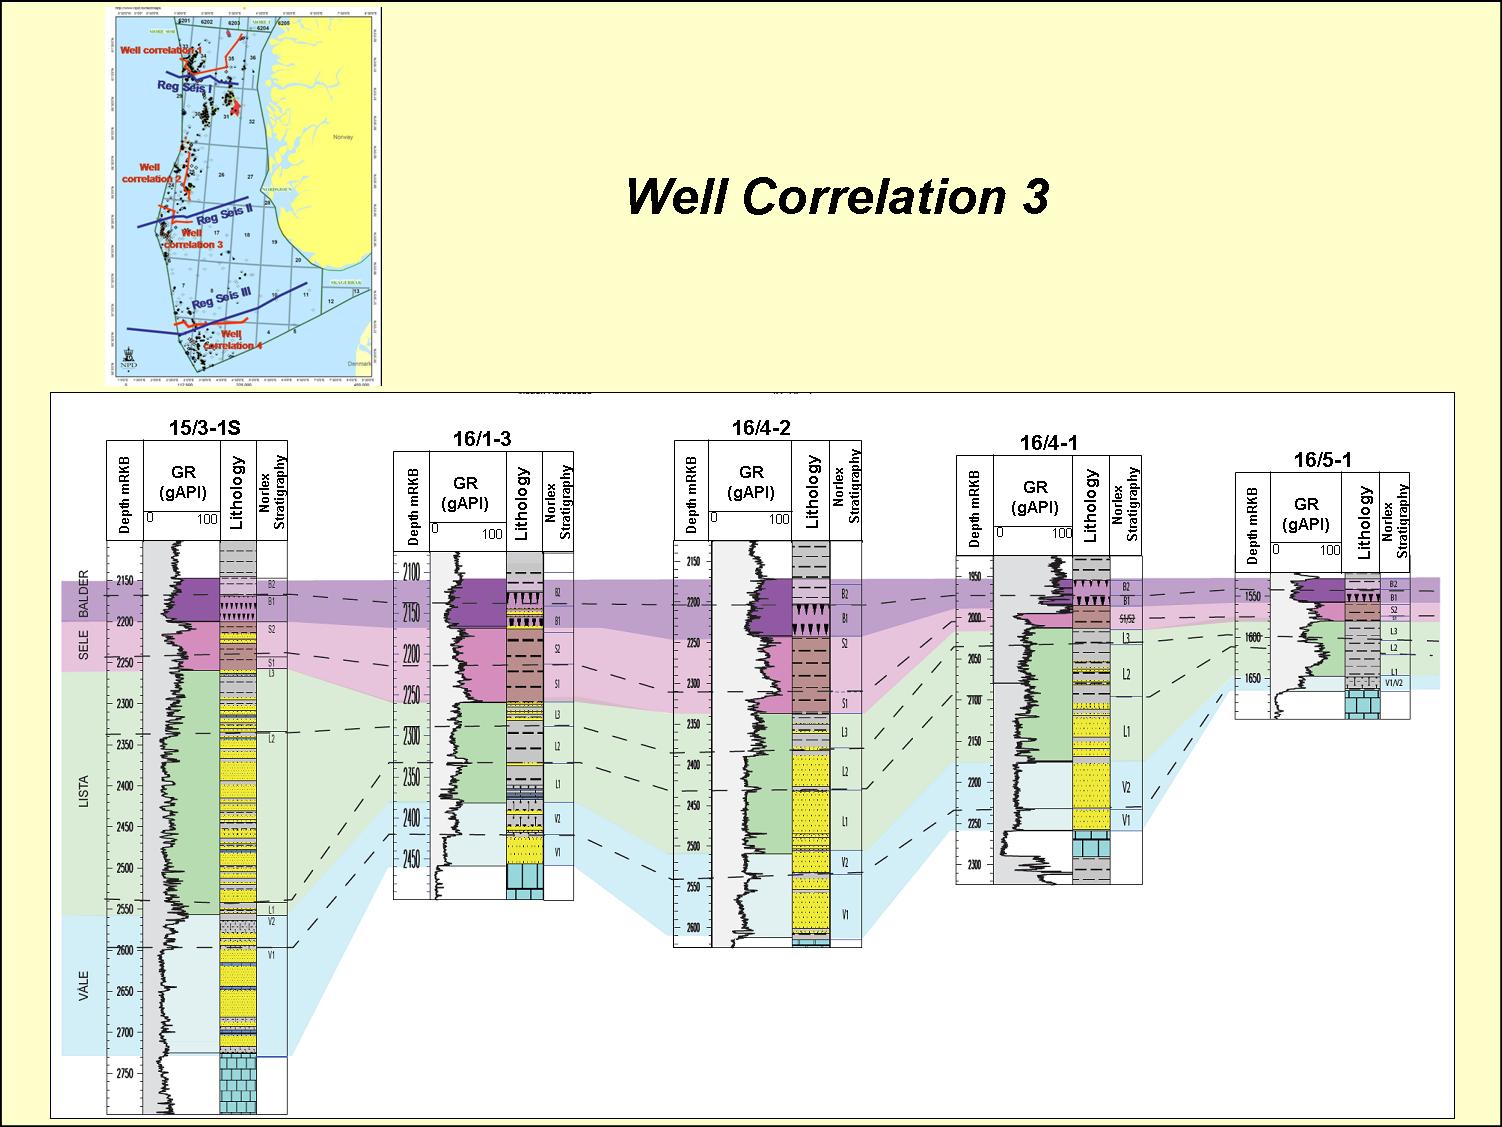
Fig. 35. Regional well correlation III |
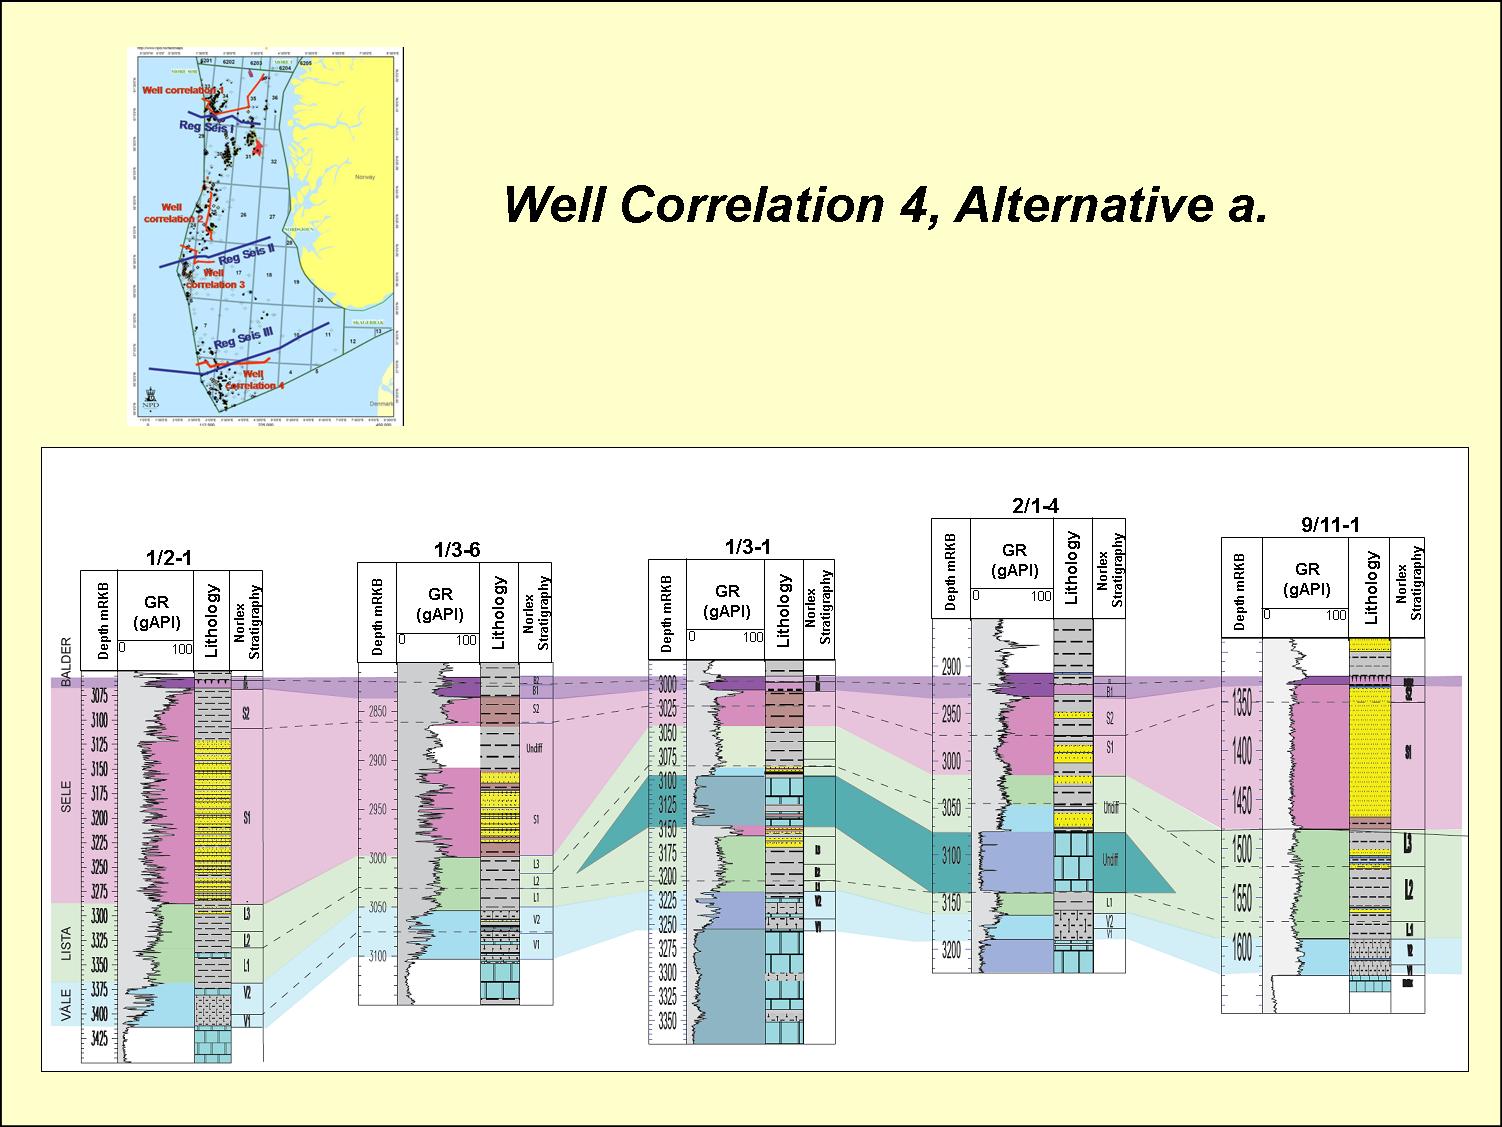
Fig. 36. Regional well correlation Alternative a. Vidar Member deposited before the Forties Member. |
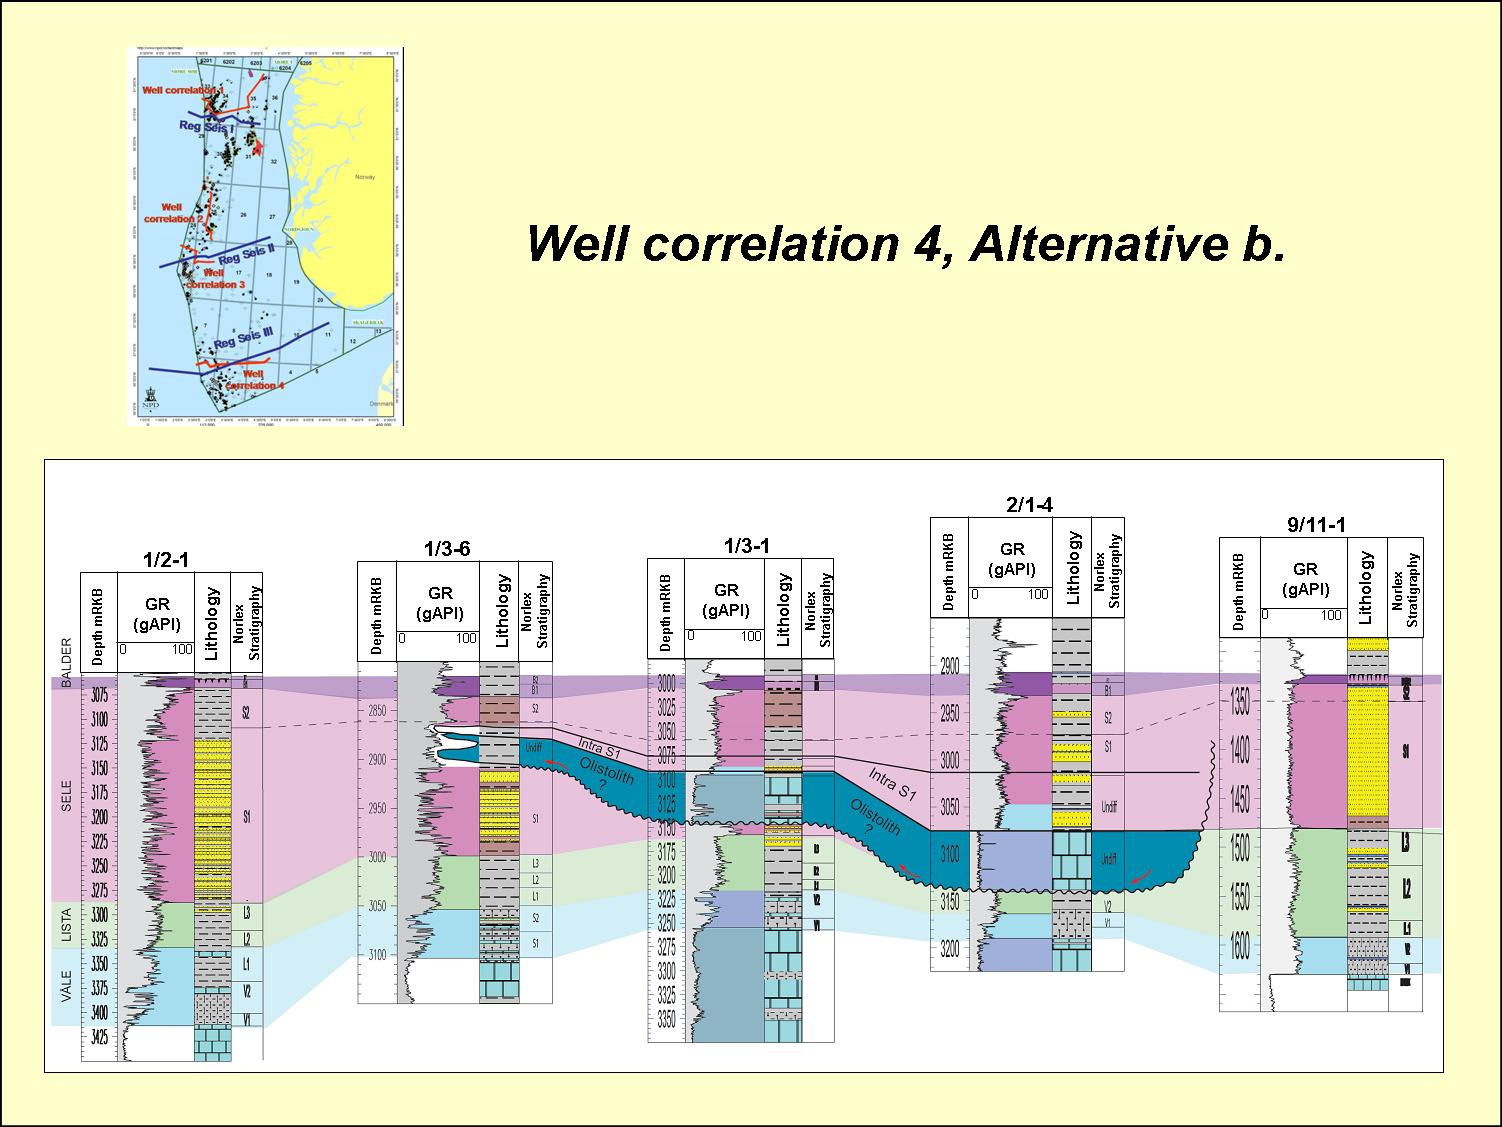
Fig. 37. Regional well correlation Alternative b. Vidar Member deposited after the Forties Member. |
The base of the Rogaland Group coincides closely with the last occurrence of Senoniasphaera inornata (Mudge & Bujak, 1996). It is marked by a reduction in diversity of benthic assemblages towards the underlying Shetland Group (Knox & Holloway, 1992). The age of the basal Rogaland Group is Late Danian and approximately 61 Ma.
Table 3 shows diagnostic biostratigraphic events based on microfossils.
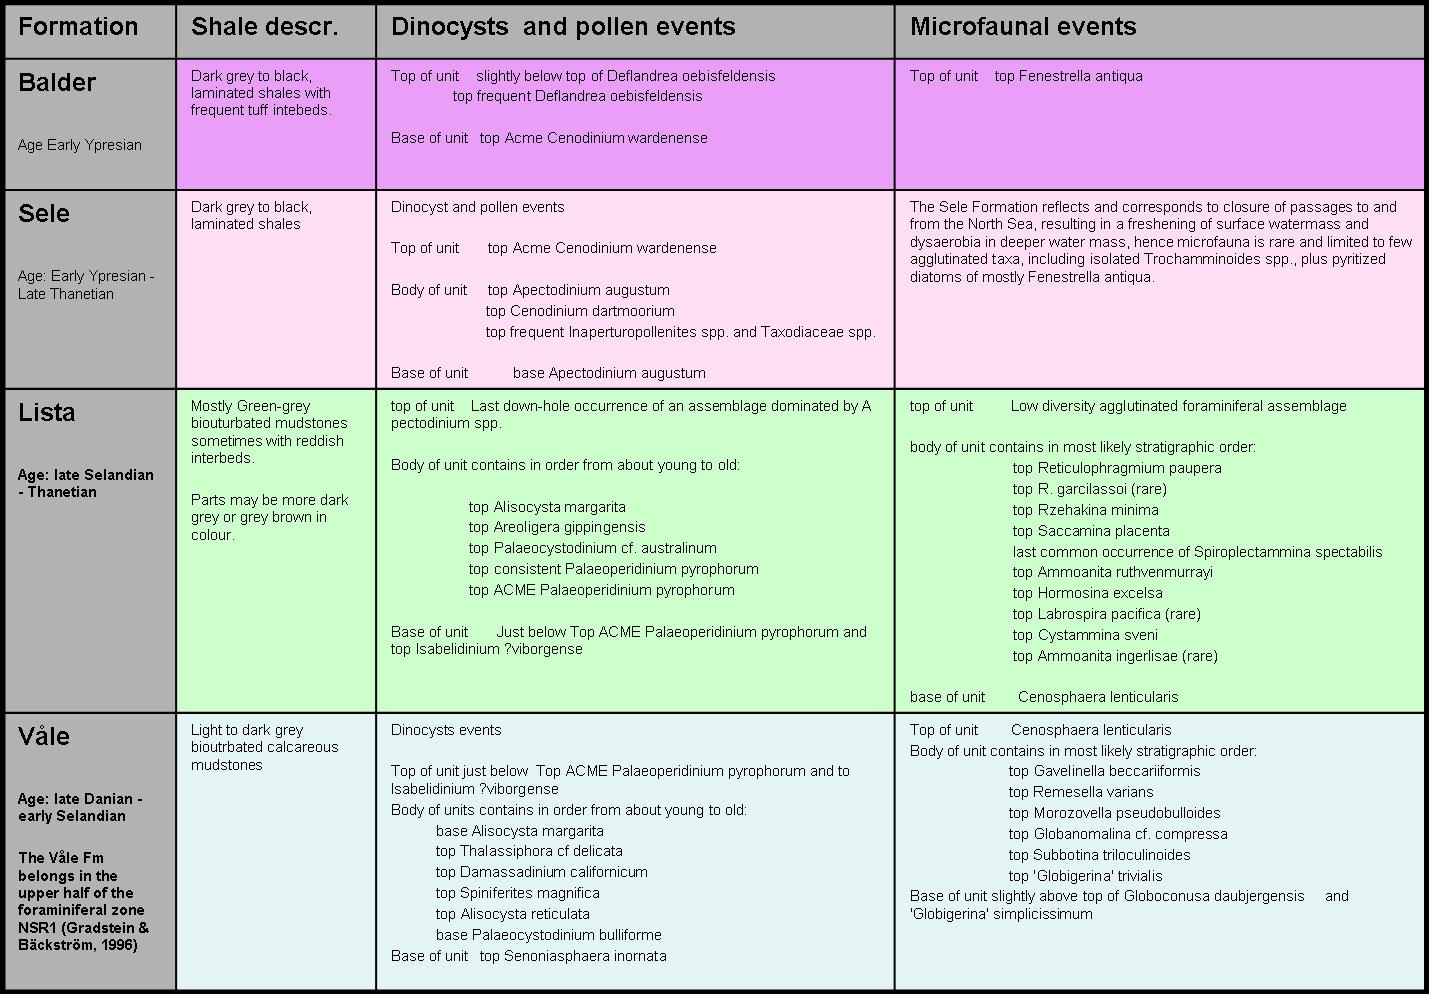
Table 3. Some important biostratigraphic events of the Rogaland Group. |
A refined sequence stratigraphic framework was established by Mudge and Bujak (1996), who used high-gamma value mudstones in combination with biostratigraphy to subdivide the Paleocene-lowermost Eocene succession (Rogaland Group plus the Ekofisk Formation of the Chalk Group) into stratigraphic sequences, high gamma mudstones being interpreted as maximum flooding surfaces. The stratigraphic position of these high-gamma mudstones shows a consistent relationship with microfossil bioevents and biostratigraphic levels (Mudge and Bujak, 1996). These high-gamma mudstones have been used as the background for the sequence stratigraphic sub division of the shale formations in this study.
Occurrences of group tops in wells
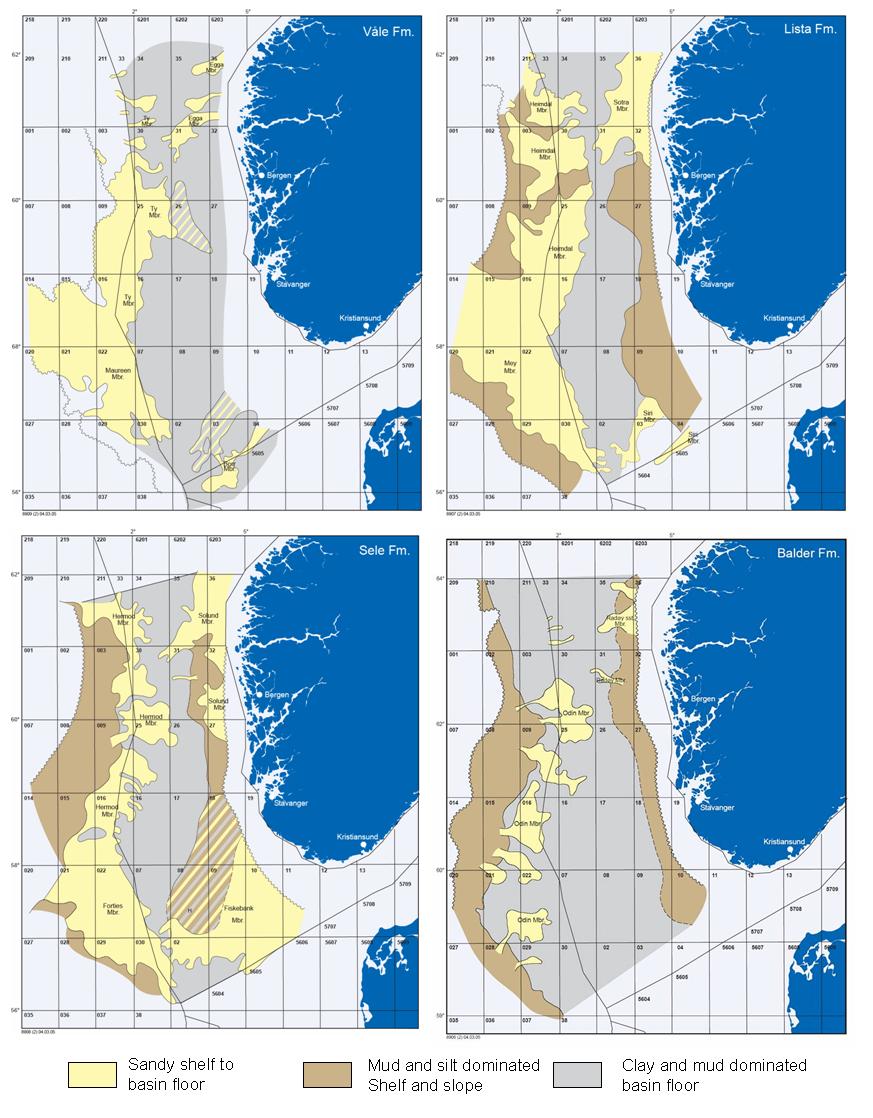
Fig. 38. Distribution of the Formations of the Rogaland Group and its sandstone members. |
It was Parker (1975) who first interpreted Paleocene sandstones of the North Sea to be submarine-fan sediments. It is now widely accepted that the dominant process for sand transport from the shelfal areas into the various basins and sub basins were of confined and unconfined gravity flows derived from either point sources or line sources (Ahmadi et al., 2003; Richards & Reading, 1994). Depositional features of confined systems involve depositional channels, sometimes erosional channels, overbank and levee deposits and channelised lobes. Features of the unconfined systems include single terminal lobes, amalgamated and compensating lobes and submarine aprons (Ahmadi et al., 2003). In both confined and unconfined systems, sand deposition and preservation have been controlled by sea-floor topography. The sedimentation process included high and low-density sediment gravity flows, slurries, slumps and debris flows.
Low-density gravity flow deposits are commonly observed in overbank deposits of levee and crevasse splays, in distal terminal lobes and distal submarine aprons. They may also be a result of flow stripping from high-density gravity flows. Slumps are common features in the overbank deposits (Ahmadi et al., 2003). High-density gravity-flow deposits often occur in confined channels, proximal terminal lobes and submarine aprons, where they exhibit massive, unstructured sandstones, massive sandstones with load and dish structures and planar-laminated sandstones. High sedimentation rates and dipping morphological gradient frequently led to post-depositional mobilization and redeposition of sediments seen as debris flow deposits, sandy injectites and slumps.
Cross plotting of S/G from wells is a technique that has been much used to predict sand/reservoir presence in Paleocene exploration targets. By cross plotting S/G data from wells drilled in a certain area, a prediction of background shale, shale cut-off, sand thickness and S/G ratio of a prospect can be made. The technique is most reliable in basinal positions, and must be limited to sub basins and sub systems since there is much variability between individual sub basins.
As a working hypothesis the following values are commonly adopted (after Richards & Reading (1994): Sand rich deep marine systems have S/G ratio 1.0-0.6, Mixed sand-mud systems 0.6-0.3 and mud rich systems <0.3. Some S/G-plots are shown in Figs. 39-41.
It must be stressed that this technique works best in basinal position with aggradation, and does normally not give a good correlation in prograding slope settings.

Fig. 39. Sand/Gross ratio for the Rogaland Group from ~300 wells in the Norwegian North Sea. From Brunstad 2002. |
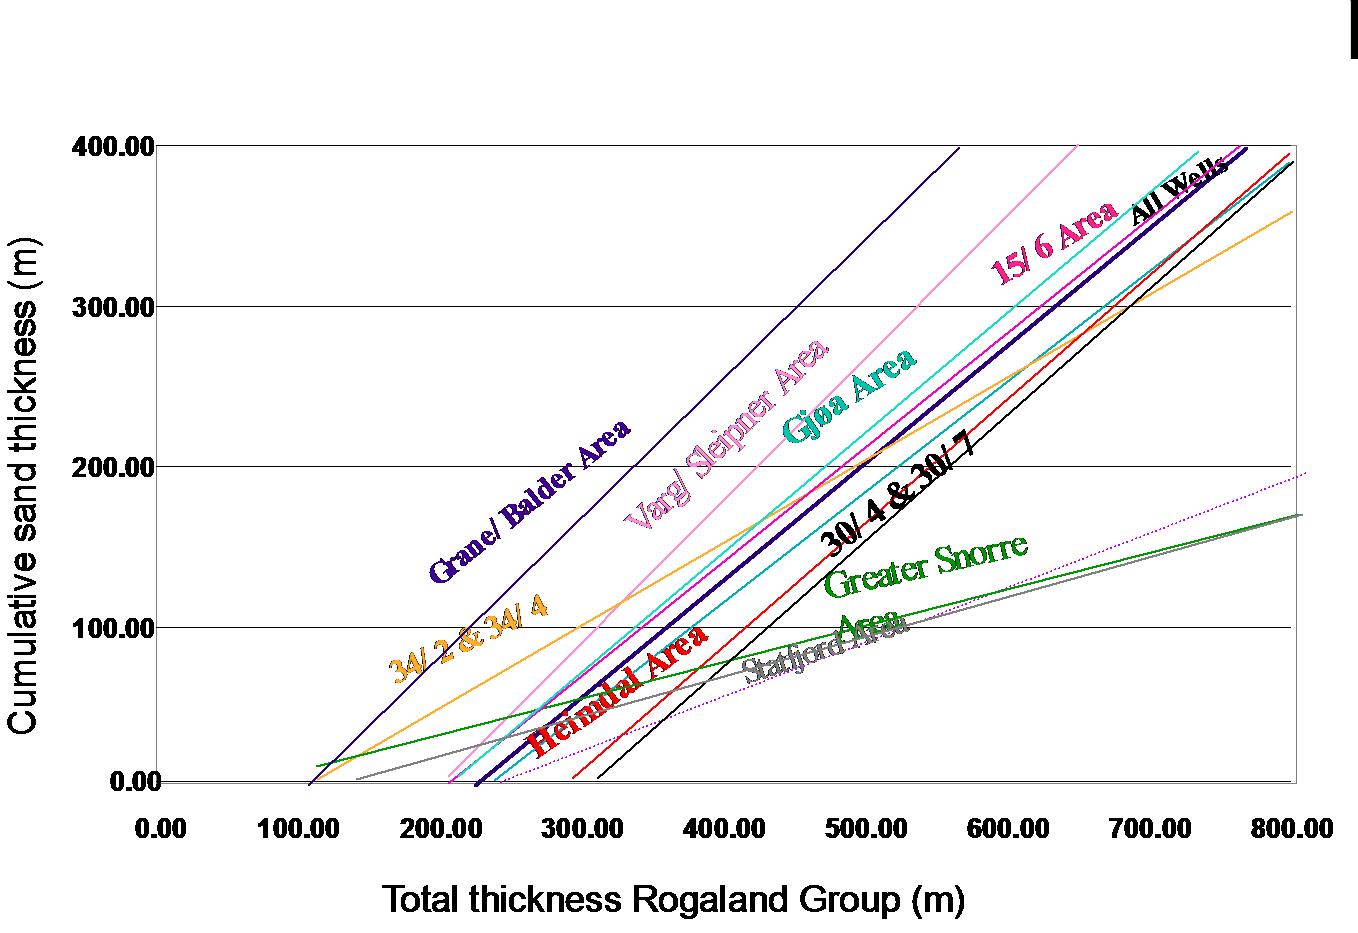
Fig. 40. Sand/Gross Trends for the Rogaland Group. Trend lines are based on cross plots of wells in various subareas of the North Sea. From Brunstad 2002. |
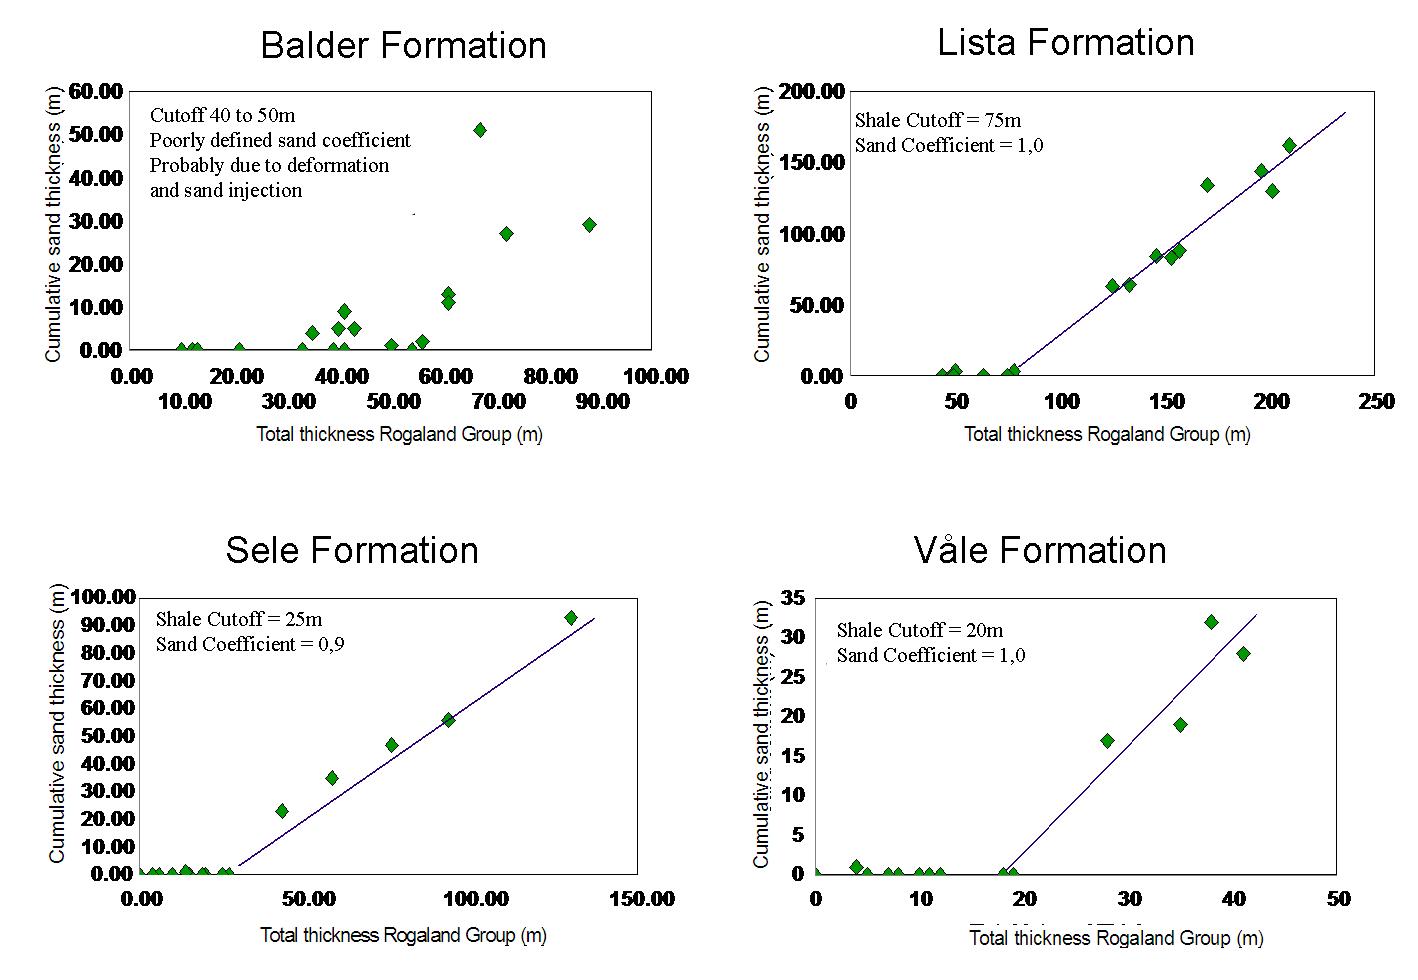
Fig. 41. Sand/Gross from cross plotting of each of the formations of the Rogaland Group in southern parts of Quadrant 25. From Brunstad 2002. Crossing point with the horizontal axsis gives the treshold thickness for sand, whereas slope of line indicates N/G that can be expected for sandstone bodies in each of the Formations. |
Bowen, G.B., Beeling D.J. Koch P.L., Zachos J.C., Quattlebaum T., 2004. A humid climate state during the Paleocene/Eocene thermal maximum. Letters to Nature. NATURE Vol. 432, 25 November 2004. P455-499.
Brunstad H., 2002. Thickness parameter cross plotting - A useful analytical and predictive tool in exploration. Poster presentation at the AAPG Hedberg Conference: "Hydrocarbon Habitat of Volcanic Rifted Passive Margins". September 8-11, 2002, Stavanger, Norway.
Clauzon, Georges, Suc, Jean-Pierre, Gautier, François, Berger, André, Loutre, Marie-France (1996). "Alternate interpretation of the Messinian salinity crisis: Controversy resolved?". Geology 24 (4): 363-366.
Conort A.,1986. Habitat of Tertiary hydrocarbons, South Viking Graben. 259-270 in Habitat of hydrocarbons on the Norwegian Continental Shelf.
Coward M.P, Dewey J., Hempton M. and Holroyd J. 2003. Chapter 2. Tectonic evolution. In: Millennium Atlas: Petroleum geology of the Central and northern North Sea. By: Evans D. Graham C., Armour A. and Bathurst P. (eds. and coordinators). Published by Geological Society of London 2003. P. 2-1 to 2-19.
Curry, D. 1992. Tertiary. In: Duff, P.McL.D. & Smith, A. J. (eds.) Geology of England and Wales, Geological Society of London, 389-411.
De Boer, W., Rawlinson, P.B. & Hurst, A. 2007. Successful exploration of a sand injectite complex: Hamsun prospect, Norway Block 24/9. In: Sand Injectites, Hurst, A. & Cartwright, J. (eds.), AAPG Memoir, Tulsa
Deegan C.E. and Scull B.J. 1977. A Standard Lithostratigraphic Nomenclature for the Central and Northern North Sea. Institute of Geological Sciences Report 77/25.
Dewhurst D.N., Cartwright J.A. and Lonergan L. 1999. The development of polygonal fault systems by syneresis of colloidal sediments. Marine and Petroleum Geology. Vol. 16. p.798-810.
Dreyer T. Bujak J., Brunstad H., Ramberg J. and Sřyseth L., 2004. Mixed deep- and shallow-water depostional model for the Forties Sandstone Member in the South Central Graben, North Sea. Norwegian Journal of Geology, Vol. 84, pp 191-233. ISSN 029-1996X.
Ebner, F.2002. Alpine Geodynamics, epigenetic mineralizations and element mobility in the Eastern Alps. Geologica Carpathia. Volume 53, September 2002. Proceedings of XVII. Congress of Carpathian-Balkan Geological Association Bratislava. September 1st - 4th 2002.
Egger H., Homayoun M. and Schnabel W. 2002. Tectonic and climatic control of Paleogene sedimentation in the Rhenodanybian Flysch basin (Eastern Alps, Austria). Sedimentary Geology v. 152 (2002) p. 242-262.
Eldholm O. and Thomas E. 1993. Environmental impact of volcanic margin formation. Earth and Planetary Science Letters, vol. 117, p319-329.
Gjelberg J., Enoksen T., Mangerud G., Martinsen O.J. & Roe E., 1999. Sedimentary environments offshore Norway. Extended Abstracts sedimentary Environments Offshore Norway. Norwegian Petroleum Society, 193-197.
(Gjelberg J., Enoksen T., Kjćrnes P., Mangerud G., Martinsen O.J., Roe E., Vĺgnes E. 2001. The Maastrichtian and Danian depositional setting along eastern margin of the eastern margin of the Mřre Basin (mid-Norwegian Shelf): implications for reservoir development of the Ormen Lange Field. In: Martinsen O.J. & Dreyer T. (eds.): Sedimentary Environments Offshore Norway-Paleozoic to Recent. NPF Special Publication 10, 421-440.
Gjelberg J. Martinsen O.J. Charnock M.A. Mřller N.K. & Antonsen P., 2005. The Reservoir Development of the Early Paleocene Ormen Lange Gas Field, Mřre Basin, Mid Norwegian Shelf. In: Doré A.G. & Vining B.A. (eds.) Petroleum Geology: North-West Europe and Global Perspectives - Proceedings of the 6th Conference. Geological Society, London 1165-1184.
Gradstein F., Ogg J.G., and Smiths A.G. (Eds.) 2004. Geological Time Scale 2004. Cambridge University Press, 500p.
Gradstein F.M. & Bäckström S., 1996. Cainozoic biostratigraphy and paleobathymetry, northern North Sea and Haltenbanken. Norsk Geologisk Tidsskrift. v.76, p.3-32.
Georgievski G. and Stanev E.V. 2006. Late Pleistocene evolution of the Black Sea watershed and fluctuations of the sea level. Geophysical Research Abstracts, Vol. 8, 09462, 2006.
Hamberg L., Dam G., Wilhelmson, and Ottesen T.G., 2005. Paleocene deep-marine sandstone plays in the Siri Canyon, offshore Denmark-southern Norway. In: Doré, A.G and Vining, B.A. (eds.) Petroleum Geology: North-West Europe and Global Perspectives-Proceedings of the 6th Petroleum Geology Conference, 1185-1198. Petroleum Geology Conference Ltd. Published by Geological Society, London.
Hardt T., Holtar E., Isaksen D., Kyllingstad G., Lervik K.S. Lycke A.S. and Tonstad K., 1989. Revised Tertiary lithostratigraphic nomenclature for the Norwegian North Sea. Norwegian Petroleum Directorate (NPD) Bulletin 5, p35-55.
Huuse, M., Duranti, D. Steinsland N., Guargena, C., Prat, P., Holm, K. Cartwright, J.A. & Hurst, A. 2004. Seismic characteristics of large-scale sandstone intrusions in the Paleogene of the South Viking Graben, UK and Norwegian North Sea. In: 3-D Seismic Technology: Applications to the Exploration of Sedimentary Basins (Davies, R.J., Cartwright, J.A., Stewart, S.A., Lappin, M. & Underhill, J.R. (eds.)). Geological Society of London Memoirs, 29 , 263-277.
Haq B.U., Hardenbol J. and Vail P.R., 1987. Chronology of fluctuating sea levels since the Triassic. Science, 235, 1156-1167.
Huuse, M., Duranti, D., Steinsland, N., Guargena, C. G., Prat, P., Holm, K., Cartwright, J. A. & Hurst, A. 2004. Seismic characteristics of large-scale sandstone intrusions in the Paleogene of the South Viking Graben, UK and Norwegian North Sea. In: Davies R. J., Cartwright J., Stewart S. A, Underhill, J. R., Lappin M. (eds.) 3D Seismic Technology: Application to the Exploration of Sedimentary Basins. Geological Society, London, Memoir, 29, 263-277.
Isaksen D. & Tonstad, K. 1989. A revised Cretaceous and Tertiary Lithostratigraphic Nomenclature for the Norwegian North Sea. Norwegian Petroleum Directorate Bulletin 5, p1-59.
Knox R.W.O'B. 1996. Correlation of the early Paleogene in northwest Europe: an overview. Geological Society, London, Special Publications 1996; v. 101; p. 1-11.
Knox R.W.O'B., Hine N. and Ali J., 1994. New information on the age and sequence stratigraphy of the type Thanetian of Southeast England. Newsletters on Stratigraphy, 30 (1), p45-60.
Knox R.W.O'B and Cordey W.G. (eds.) 1992 Lithostratigraphic nomenclature of the UK North Sea. British Geological Survey, Nottingham.
Knox R.W.O'B & Holloway S., 1992. Paleogene of the Central and Northern North Sea. In: Knox R.W.O'B and Cordey W.G. (eds.) Lithostratigraphic nomenclature of the UK North Sea. British Geological Survey, Nottingham.
Liu X. & Galloway W.E.,1995. Quantitative Determination of Tertiary Sediment supply to the North Sea Basin. AAPG Bulletin, V.81, No. 9, p1482-1509.
Morton A.C., Hallsworth C.R and Wilkinson G.C., 1993. Stratigraphic evolution of sand provenance during Paleocene deposition in the North Sea area. In: Parker J.R. (ed.) Petroleum Geology of Northwest Europe: Proceedings of the 4th Conference. Geological Society, London, p 73-84.
Lien T. 2005. From rifting to drifting: effects on the development of deep-water hydrocarbon reservoirs in a passive margin setting, Norwegian Sea. Norwegian Journal of Geology, v.85,pp319-332.
Lutherbacher J., Dietrich D., Xoplaki E., Grosjean, M. and Wanner H., 2004. European seasonal and annual temperature variability, trends, and extremes since 1500. Science 303: 1499-1503.
Milton N.J., Bertram G.T. & Vann I.R., 1990. Paleocene tectonics and sedimentation in the Central North Sea. In Hardman R.F.P & Brooks J. (eds.) Tectonic Events Responsible for Britain's Oil and Gas reserves. Geological society, London, Special Publication, 55, p399-351-
Moryan K., Backman J., Brinkhuis J., Clemens S.C., Cronin T., Dickens G.R. Eynaud F., Gattacceca J., Jacobsen, M. Jordan R. W. Kaminsky M., King J. Koc N., Krylov A., Martinez N. Matthiesen J., McInroy D., Moore T.C., Onodera J., O'Reagan M., Pälike H., Rea B., Rio D., Sakamoto T., smith D.C., Stein R., StJohn K., Suto I., Suzuki N., Takahashi K., Watanabe M., Yamamoto M., Farrel J., Frank M., Kubik P. Jokat W. And Kristoffersen Y. 2006. The Cenozoic paleoenvironment of the arctic ocean. Nature, Vol 441/1 June 2006. p601-605.
Mudge D. & Bujak J.P. 1994. Eocene stratigraphy of the north Sea Basin. Marine and Petroleum Geology, v.11, p 166-181.
Mudge D. and Bujak J.P., 1996. An integrated stratigraphy for the Paleocene and Eocene of the North Sea. From: Knox R.W.O'B-, Corfield R.M. and Dunay R.E. (eds.), Correlation of the Early Paleogene in North West Europe, Gological Society Special Publication No. 101, pp 91-113.
Mudge D. C. and Bujak J. P., 2001. Biostratigraphic evidence for evolving palaeoenvironments in the Lower Paleogene of the Faeroe-Shetland Basin. Marine and Petroleum Geology, volume 18, Issue 5, May 2001, Pages 577-590.
Mudge D.C.. & Copestake P.,1992. Revised Lower Paleogene lithostratigraphy for the outer Moray Firth, North Sea. Marine and Petroleum Geology, vol. 9, p 53-69.
Mudge D.C. & Jones S.M, 2004. Palaeocene uplift and subsidence events in the Scotland-Shetland and North Sea region and their relationship to the Iceland Plume. Journal of the Geological Society, May 2004
Möller N.K., Gjelberg J.G. Martinsen O.J. Charnock M.A. Fćrseth R.B. Sperrevik S. Cartwright J.A.: A geological model for the Ormen Lange hydrocarbon reservoir. Norwegian Journal of Geology, v.84, pp169-190.
Nadin P.A. and Kusznir N.J, 1996. Forward and reverse stratigraphic modelling of Cretaceous-Tertiary post-rift subsidence and paleogeographic uplift in the Outer Moray Firth Basin, central North Sea. From: Knox R.W.O'B-, Corfield R.M. and Dunay R.E. (eds.), Correlation of the Early Paleogene in North West Europe, Geological Society Special Publication No. 101, pp 43-62.
Neal J.E., 1996. A summary of Paleogene sequences stratigraphy in North West Europe and the North Sea. From: Knox R.W.O'B-, Corfield R.M. and Dunay R.E. (eds.), Correlation of the Early Paleogene in North West Europe, Gological Society Special Publication No. 101, pp 15-42.
Neal J.E., 1996. A summary of Paleogene sequence stratigraphy in northwest Europe and the North Sea. From: Knox R.W.O'B , Corfield R.M and Dunay R.E. (eds.), Correlation of the Early Paleogene in Northwest Europe. Geological Society, London, Special Publications 1996; v. 101; p. 15-42.
Nielsen S.B, Thomsen E., Hansen D.L. and Clausen O.R., 2005. Plate-wide stress relaxation explains European Palaeocene basin inversions. Nature 435, p 195-198.
Parker J.R. 1975. Lower Tertiary sand development in the central North Sea. In: Woodland A.W. (ed.) Petroleum and the Continental shelf of NW Europe, Volume 1, Geology. Institute of Petroleum & Applied Science Publishers, Barking, p.447-452.
Reading, H.G. and Richards, M., 1994. Turbidite systems in deep-water basin margins classified by grain size and feeder system. AAPG Bulletin 78, pp. 792-822.
Richie J.D & Hitchen H. 1996. Early Paleocene offshore igneous activity to the northwest of the UK and its relationship to the North Atlantic Igneous Province. From: Knox R.W.O'B-, Corfield R.M. and Dunay R.E. (eds.), Correlation of the Early Paleogene in North West Europe, Geological Society Special Publication No. 101, pp 63-78.
Schiřler P, Andersjerg J., Clausen O.R., Dam G. Dybkjćr K., Hamberg M.; Prince I. And Rasmussen J. A., 2007. Lithostratigraphy of the Paleogene - Lower Neogene succession of the Danish North Sea. Geological Survey of Denmark and Greenland Bulletin 12, 2007. ISSN 1604-8156. ISBN 978-87-7871-196-0.
Simmons M.D., Sharland P.R., Casey D.M., Davies R.B. And Sutcliffe O.E. 2007. Arabian Plate sequence stratigraphy: Potential implications for global chronostratigraphy. Geoarabia, Vol. 12. No. 4. Gulf Petrol.ink, Bahrain.
Sluijs A., Schouten S., Pagani M., Woltering M., Brinkhuis H., Sinninghe Damsté J.S., Dickens G.R., Huber M., Reichart G.-J., Stein R., Matthiessen J., Lourens L.J., Pedentchouk N., Backman J., Moran K. and the Expedition 302 Scientists, 2006. Subtropical Arctic Ocean temperatures during the Palaeocene/Eocene thermal maximum. Nature 441, 610-613.
Stewart I.J., 1987. A revised stratigraphic interpretation of the early Paleogene of the Central North Sea. In: Brooks J. & Glennie K.W. (eds.) Petroleum Geology of NW Europe. Graham & Trotman, London p 557-576.
Torsvik T.H., Carlos D., Mosar J.L., Cocks R.M., and Malme T.J. 2002. Global reconstructions and North Atlantic paleogeography 440 MA to recent. IN Eide, E.A. (ed.), BATLAS - Mid Norway plate reconstruction atlas with global and Atlantic perspectives. Geological Survey of Norway.
Vandenberghe N. Laga P. Steurbaut E., Hardenbol J. And Vail P.R., 1998. Tertiary sequence stratigraphy at the southern border of the North Sea Basin in Belgium. In: de Graciansky P.-C., Hardenbol J., Jacquin T. and Vail P.R. (eds.): Mesozoic and Cenozoic Sequence Stratigraphy of European Basins. Society for Sedimentary Geology (SEPM), Special Publication 60:119-154.
Vandenberghe N., Van Simaeys S., Steurbaut E., Jagt J.W.M. and Felder P.J., 2004. Stratigraphic architecture of the Upper Cretaceous and Cenozoic along the southern border of the North Sea Basin in Belgium. Netherlands Journal of Geosciences / Geologie en Mijnbouw 83 (3): 155-171.
Vergara L., Wreglesworth I., Trayfoot M. and Richardsen G., 2001. The distribution of Cretaceous and Paleocene deep-water reservoirs in the Norwegian Sea Basins. Petroleum Geoscience, Vol. 7 2007. pp. 395-408.
Ziegler P.A., 1988. Evolution of the Arctic-North Atlantic and the Western Tethys. AAPG Memoir 43. Tulsa 1988. 196 pp.
Ziegler,P.A. 1990. Geological Atlas of Western and Central Europe, 2nd Edition. Shell
Shell Internationale Maatschappij B.V.., The Hague.
| home | previous page |